Industry
Raw material price analytics for research and universities
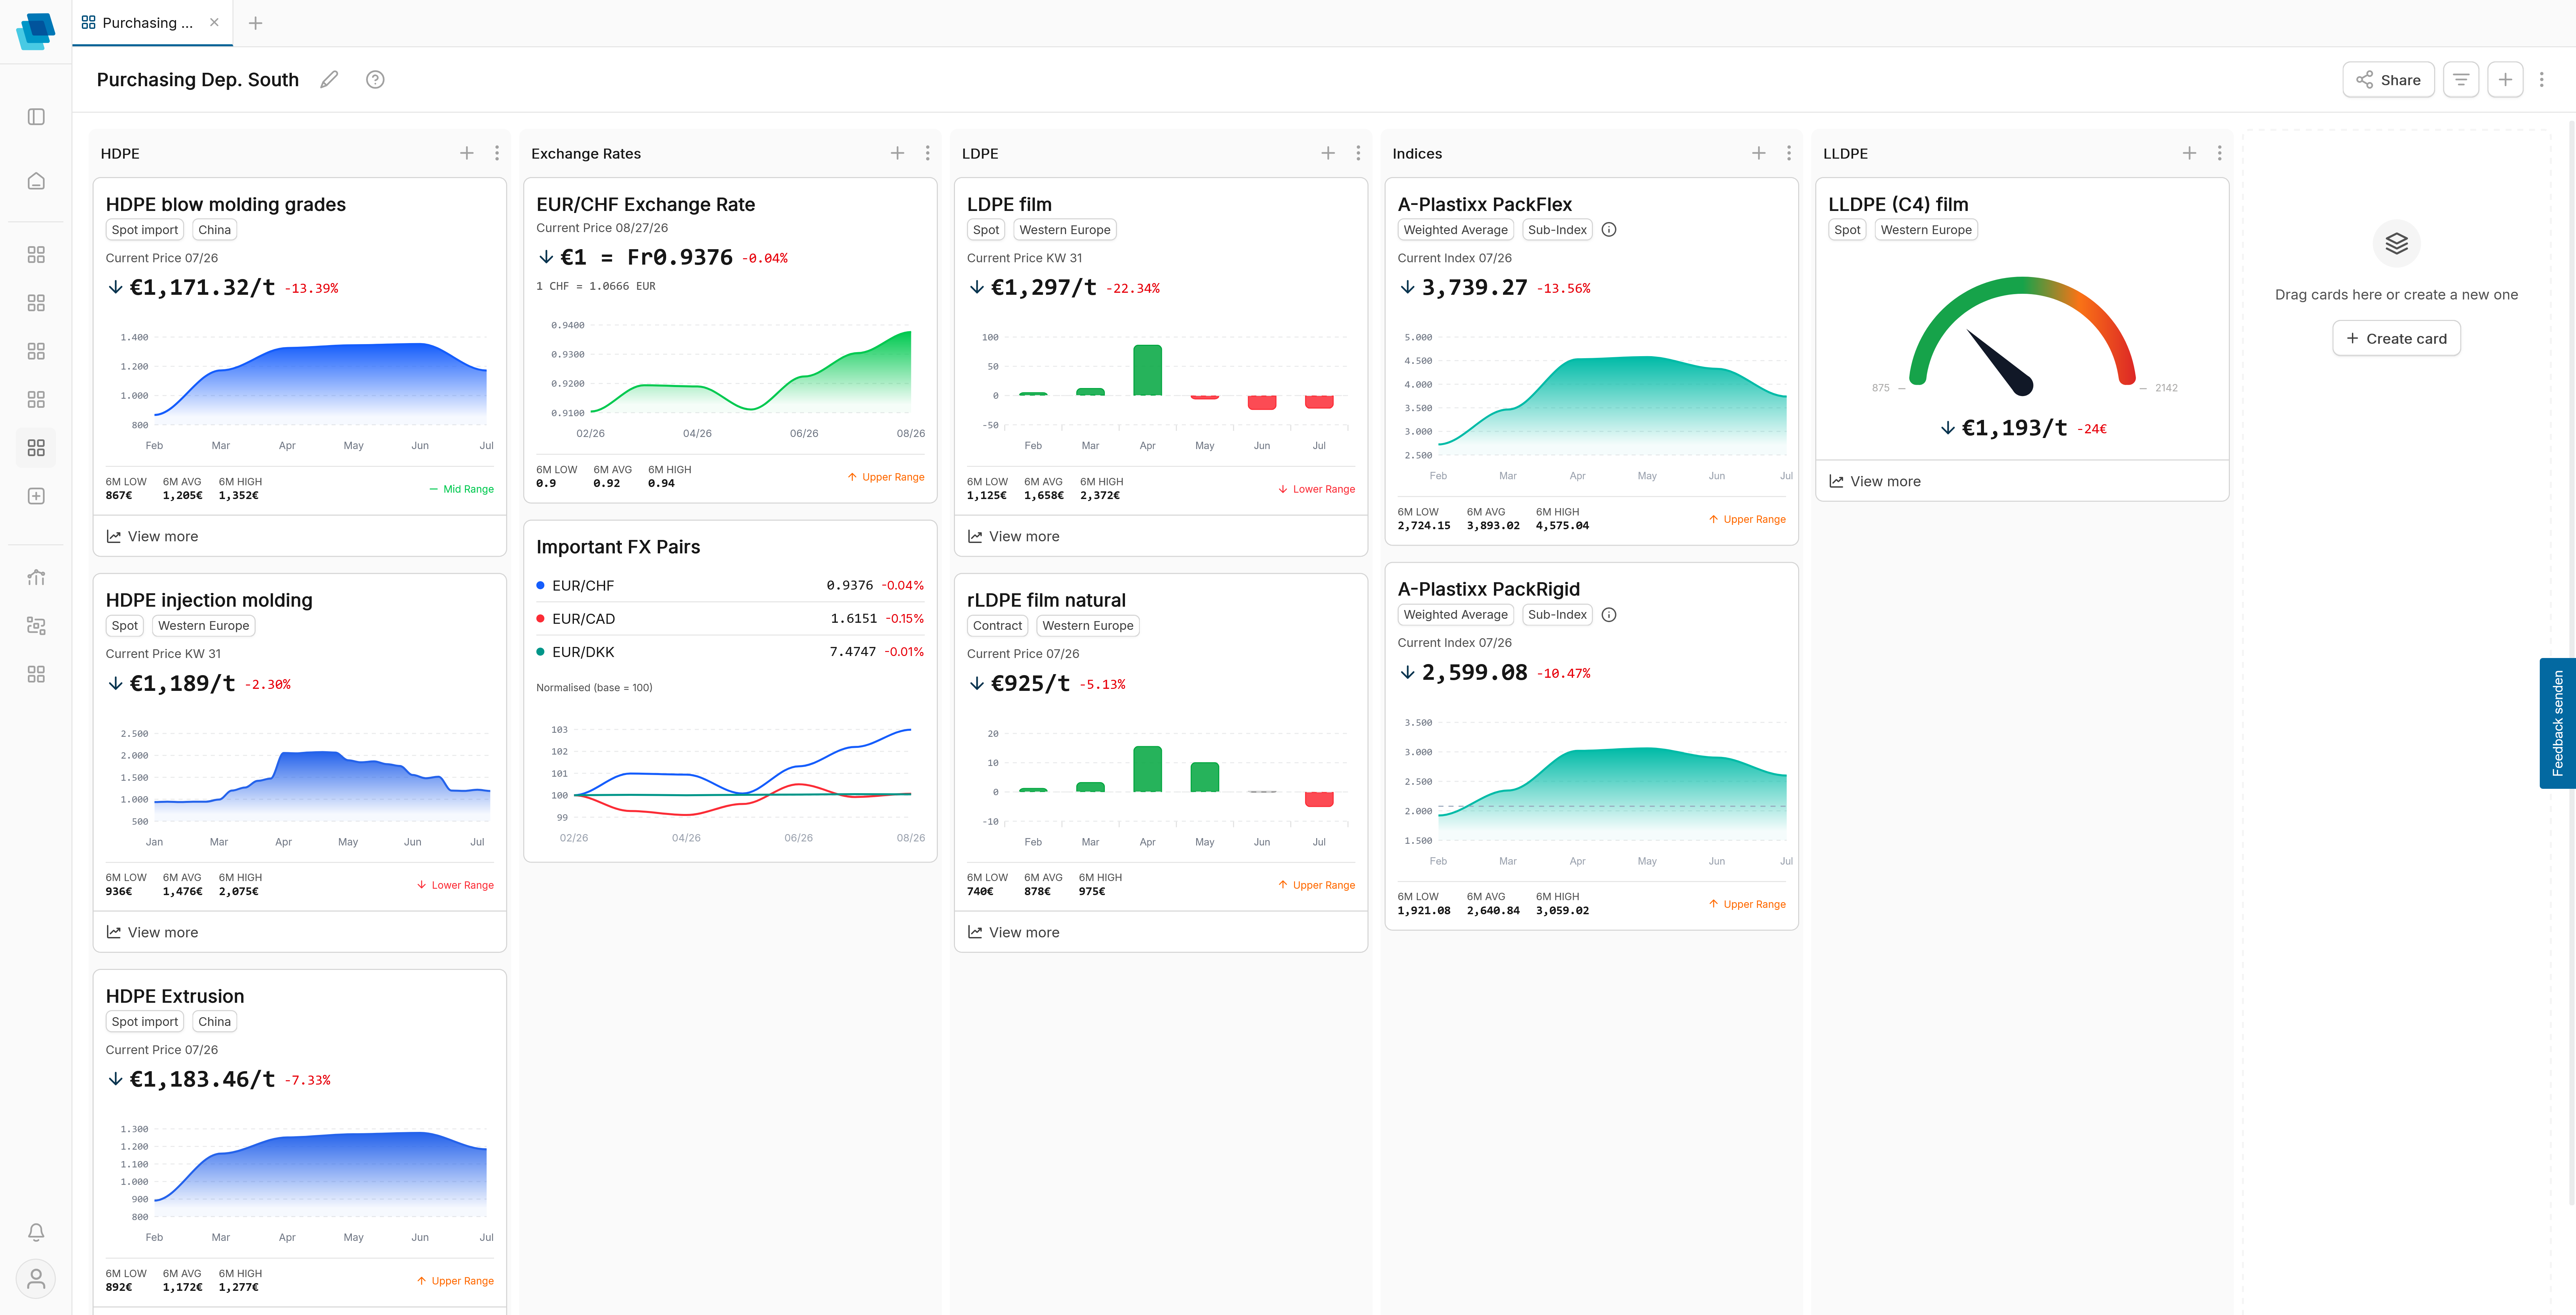
For research, teaching, and application-oriented scientific projects, transparent, and systematically collected plastics price data provide valuable market context. pricenxt makes price developments interactively analysable and supports the comparison of raw materials, price series, and time periods.

Companies that rely on pricenxt









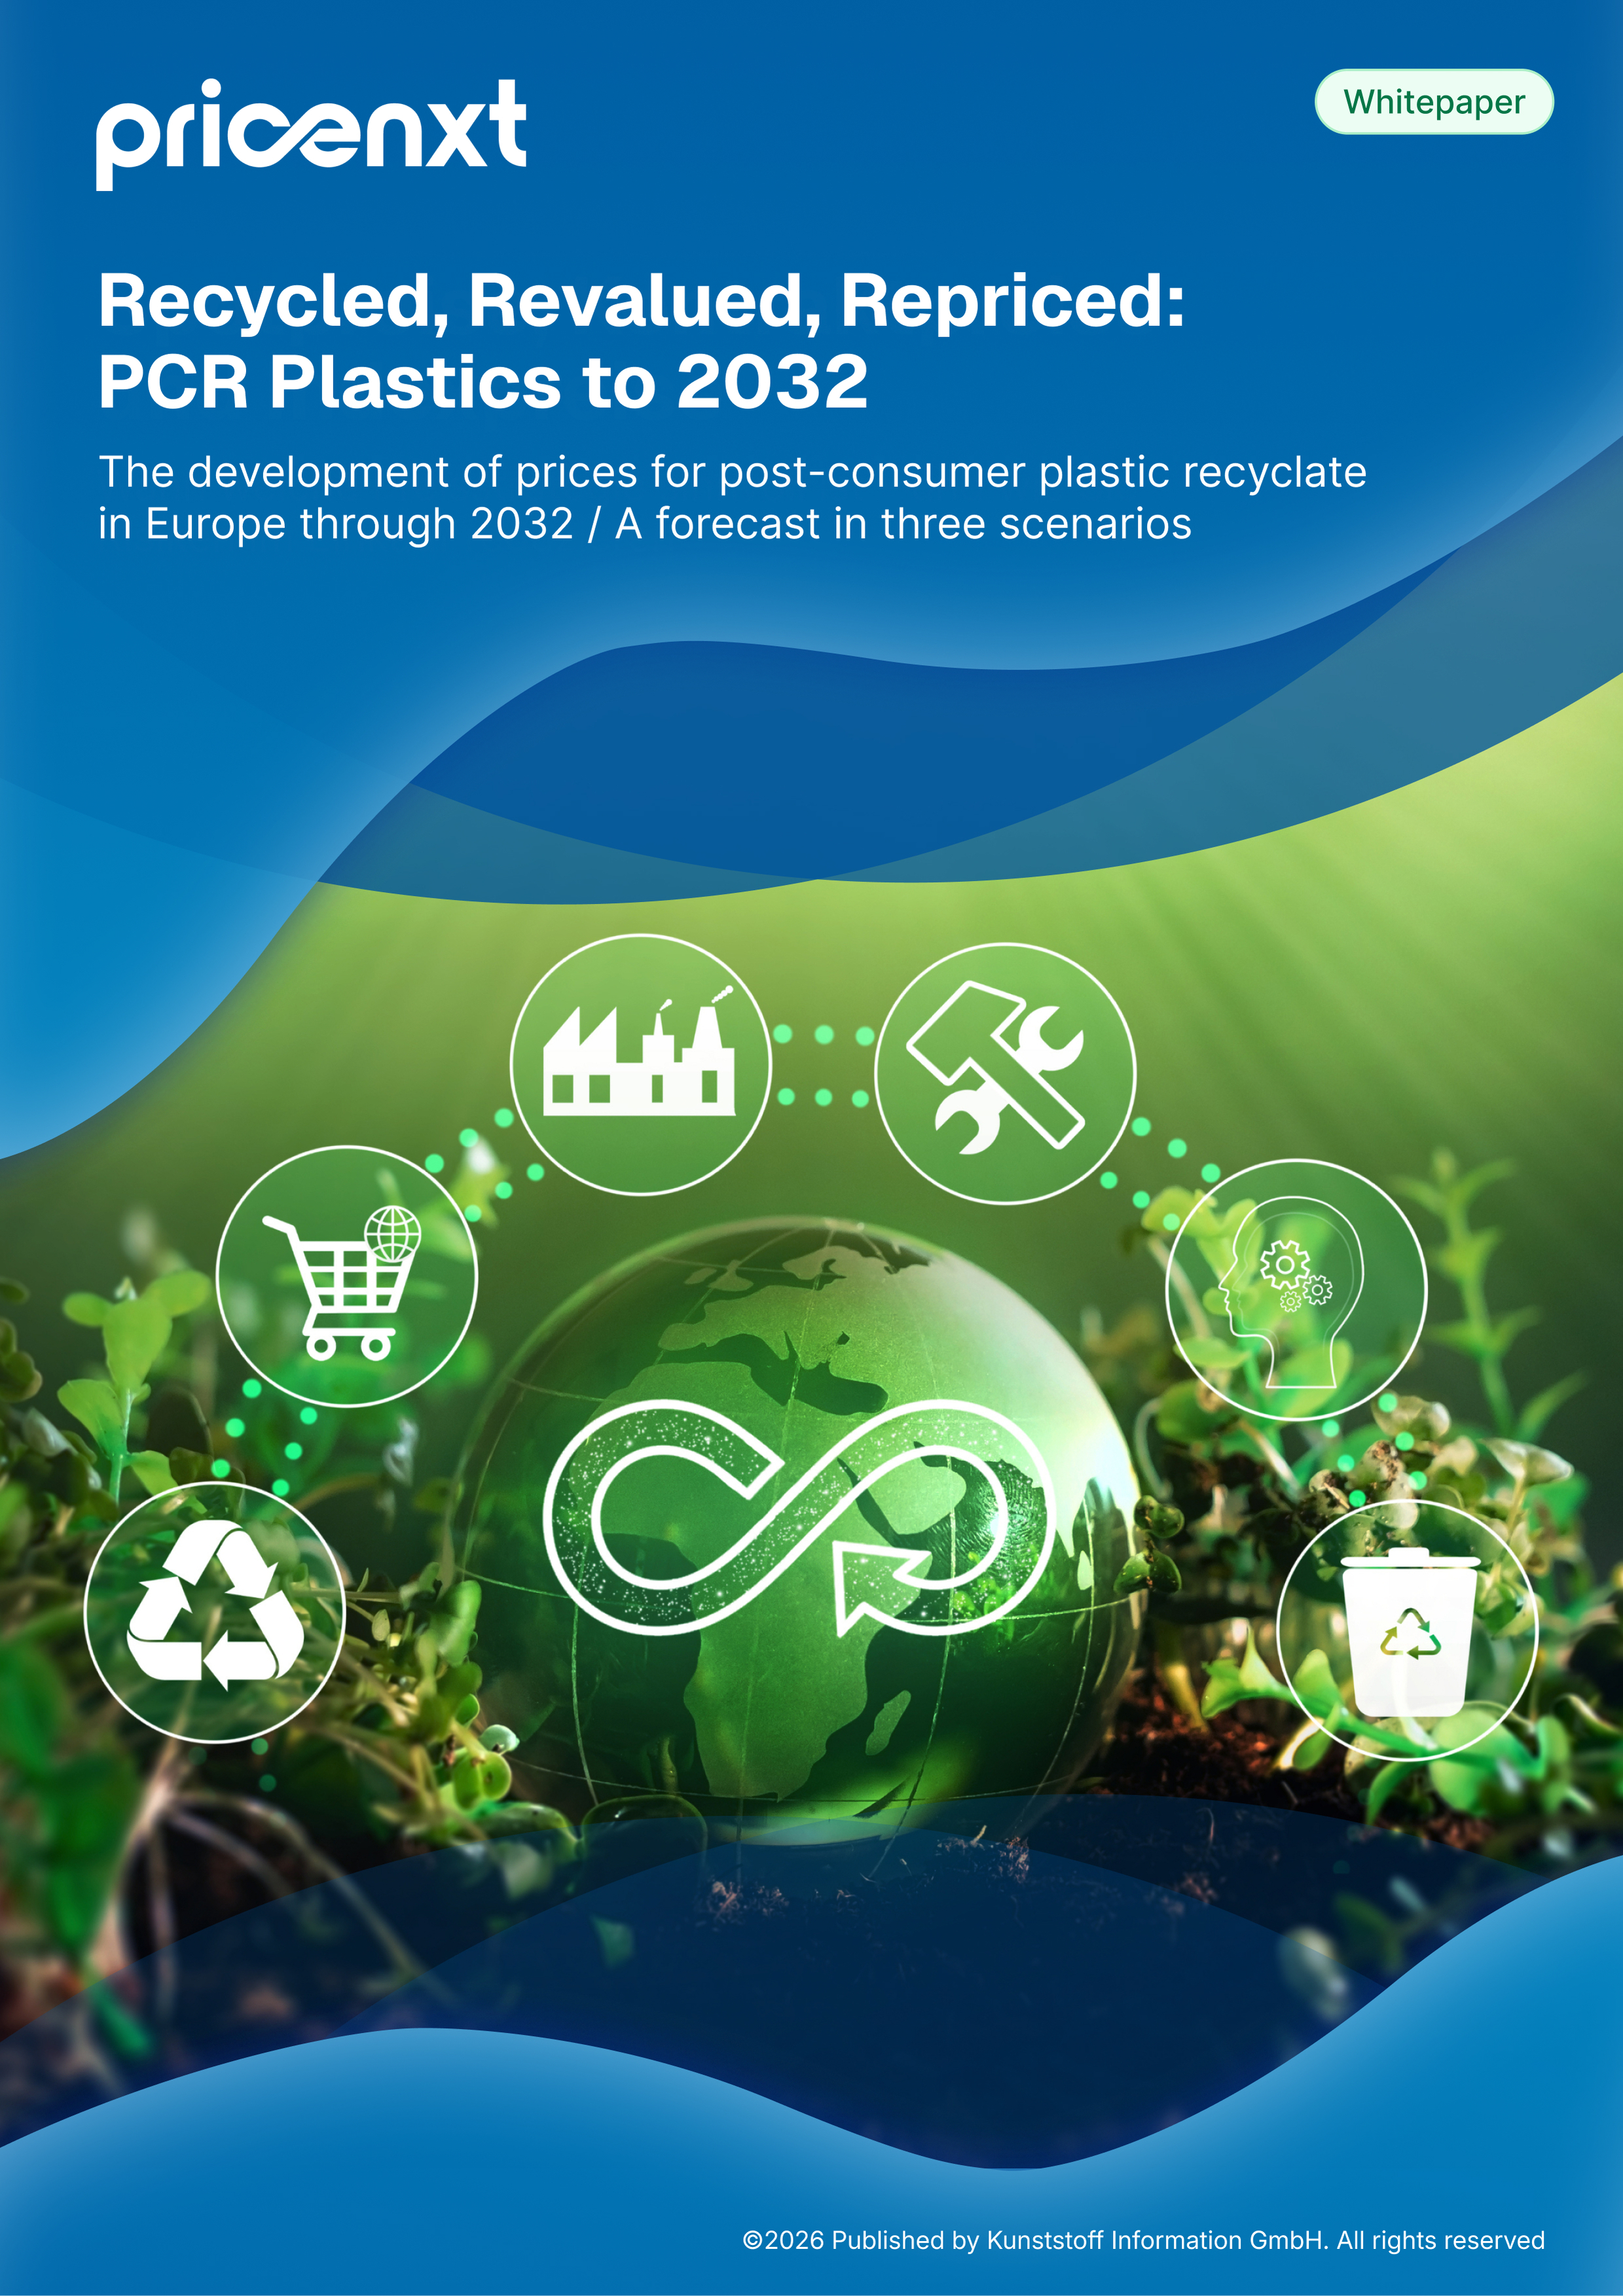
Recycled, revalued, repriced: PCR plastics to 2032
The trend in prices for post-consumer plastic recyclate in Europe up to 2032. A forecast based on three scenarios.
Value for your industry
pricenxt for research and universities
The pricenxt Analytics for raw material prices that lets teams in research, universities and science capture price developments faster, compare price series and build up their own structured market monitoring.
Challenges in research and universities
Research and teaching need data that can be explored, visualised, and used quickly for different questions.
- Market data has to be explainable
Students and project teams benefit from charts, tooltips, and clear price history analyses. - Comparisons are methodologically relevant
Variants, price indices and time periods can be compared in a structured way in shared analysis views. - Results have to be documented
Saved analyses, exports and share links support seminar papers, studies, and project reports.


Who benefits from reliable material price data?
From analysis to decision: pricenxt helps teams in research, universities and science understand, assess and communicate price developments.
- Researchers analyse price developments, correlations and trends as market context for projects and studies.
- Teaching staff use interactive charts to convey price movements and industrial relationships clearly.
- Students and project teams compare raw materials, price series, and time periods for exercises, dissertations or case studies.
How research and universities use pricenxt
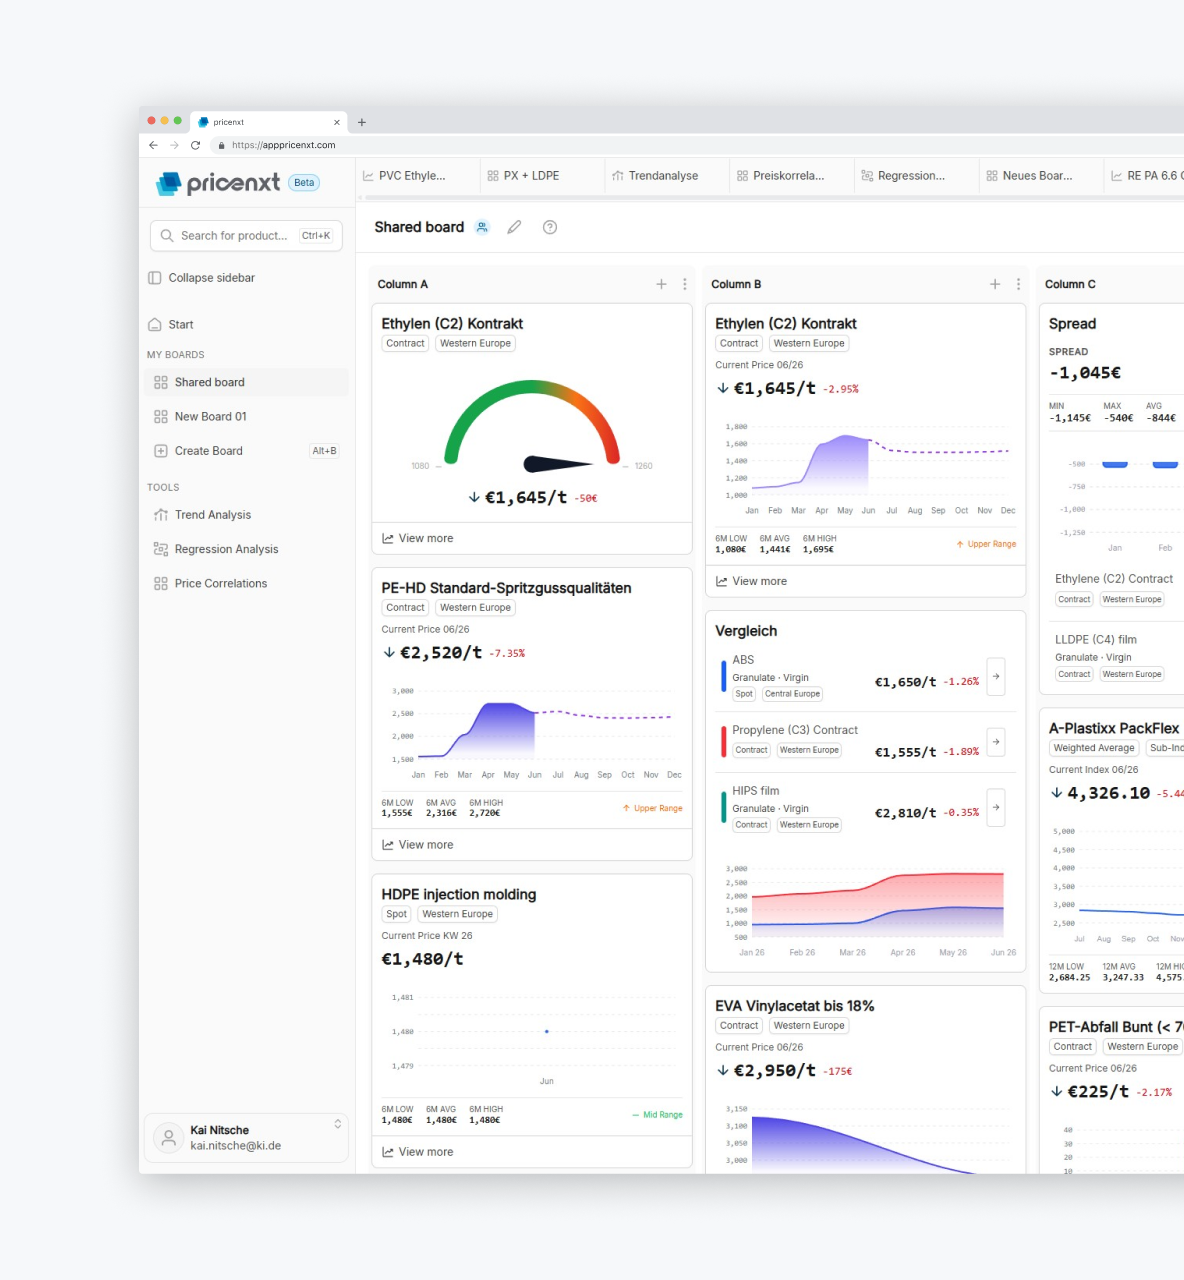
pricenxt combines product search, interactive chart analysis, configurable price cards, and personal boards in one browser-based workspace.
- Explore data
Free-text search, categories and filters help to find relevant products and price series quickly. - Visualise analyses
Line, bar, delta, index and forecast views support the evaluation of price developments, where available. - Secure results
Charts can be saved, exported and used via a share link for project work or teaching.
pricenxt. Try it for 30 days.
Use pricenxt free for 30 days. Analyse price movements, forecasts and much more.