Industry
Raw material price analytics for the chemical industry
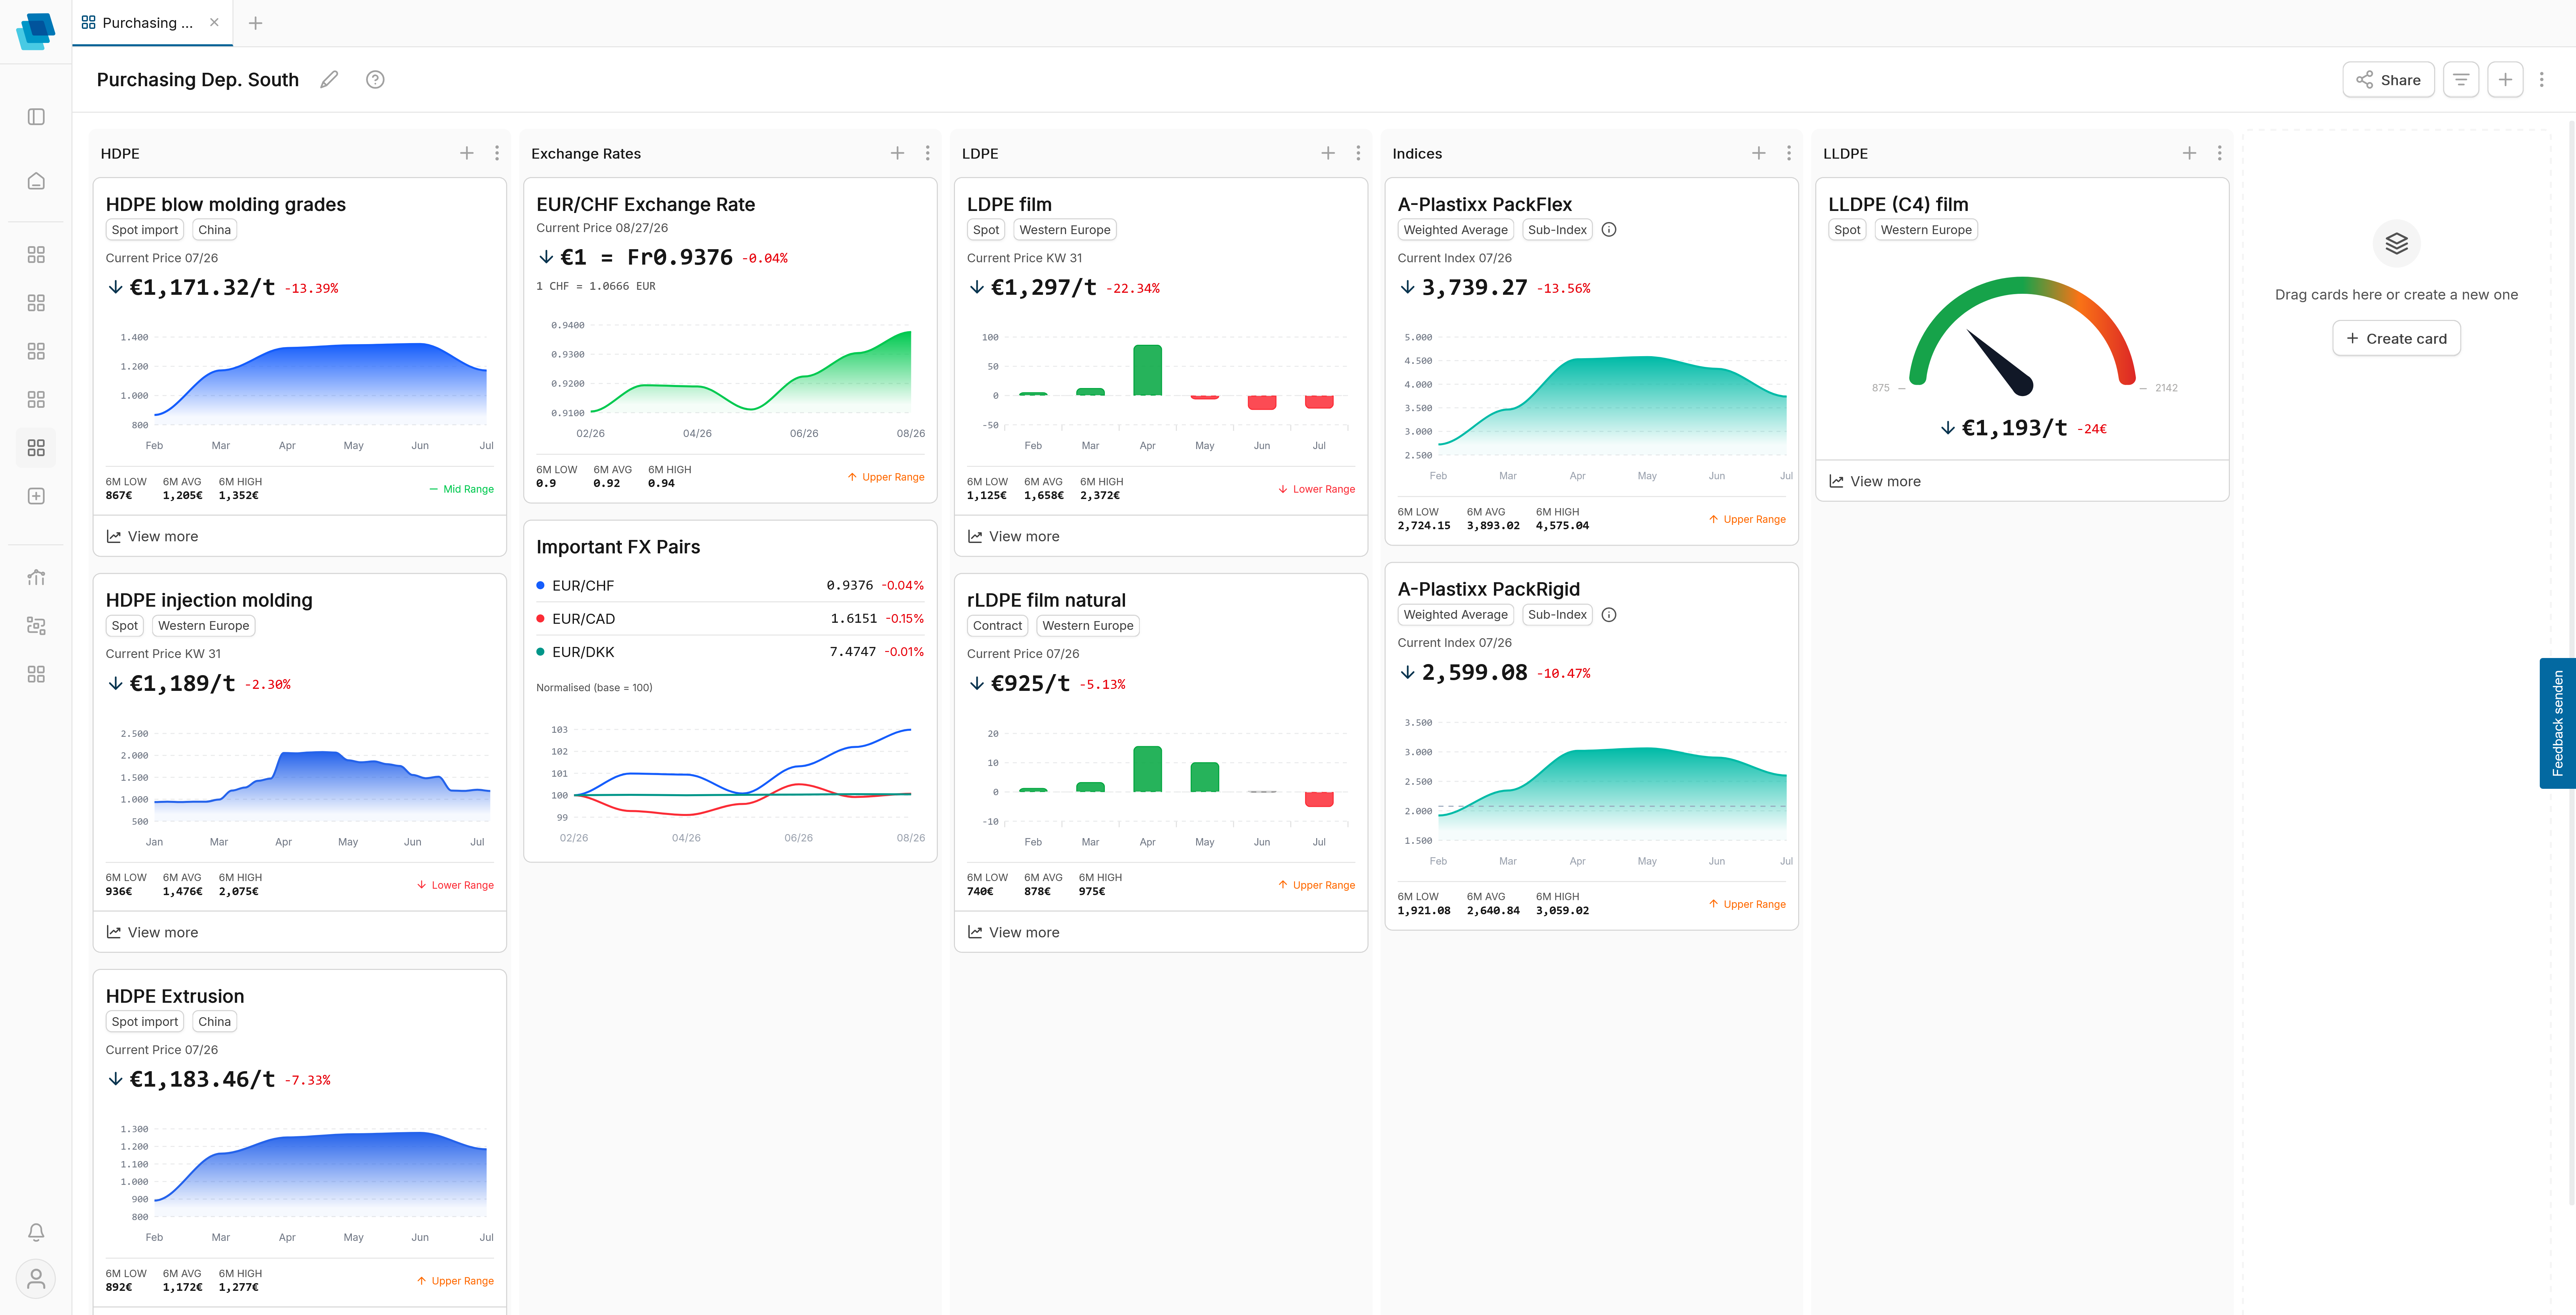
In the chemical industry, feedstock, and polymer prices influence procurement, portfolio, pricing, and customer discussions. pricenxt makes relevant price series interactively analysable and helps teams capture market movements faster and make them comparable.

Companies that rely on pricenxt









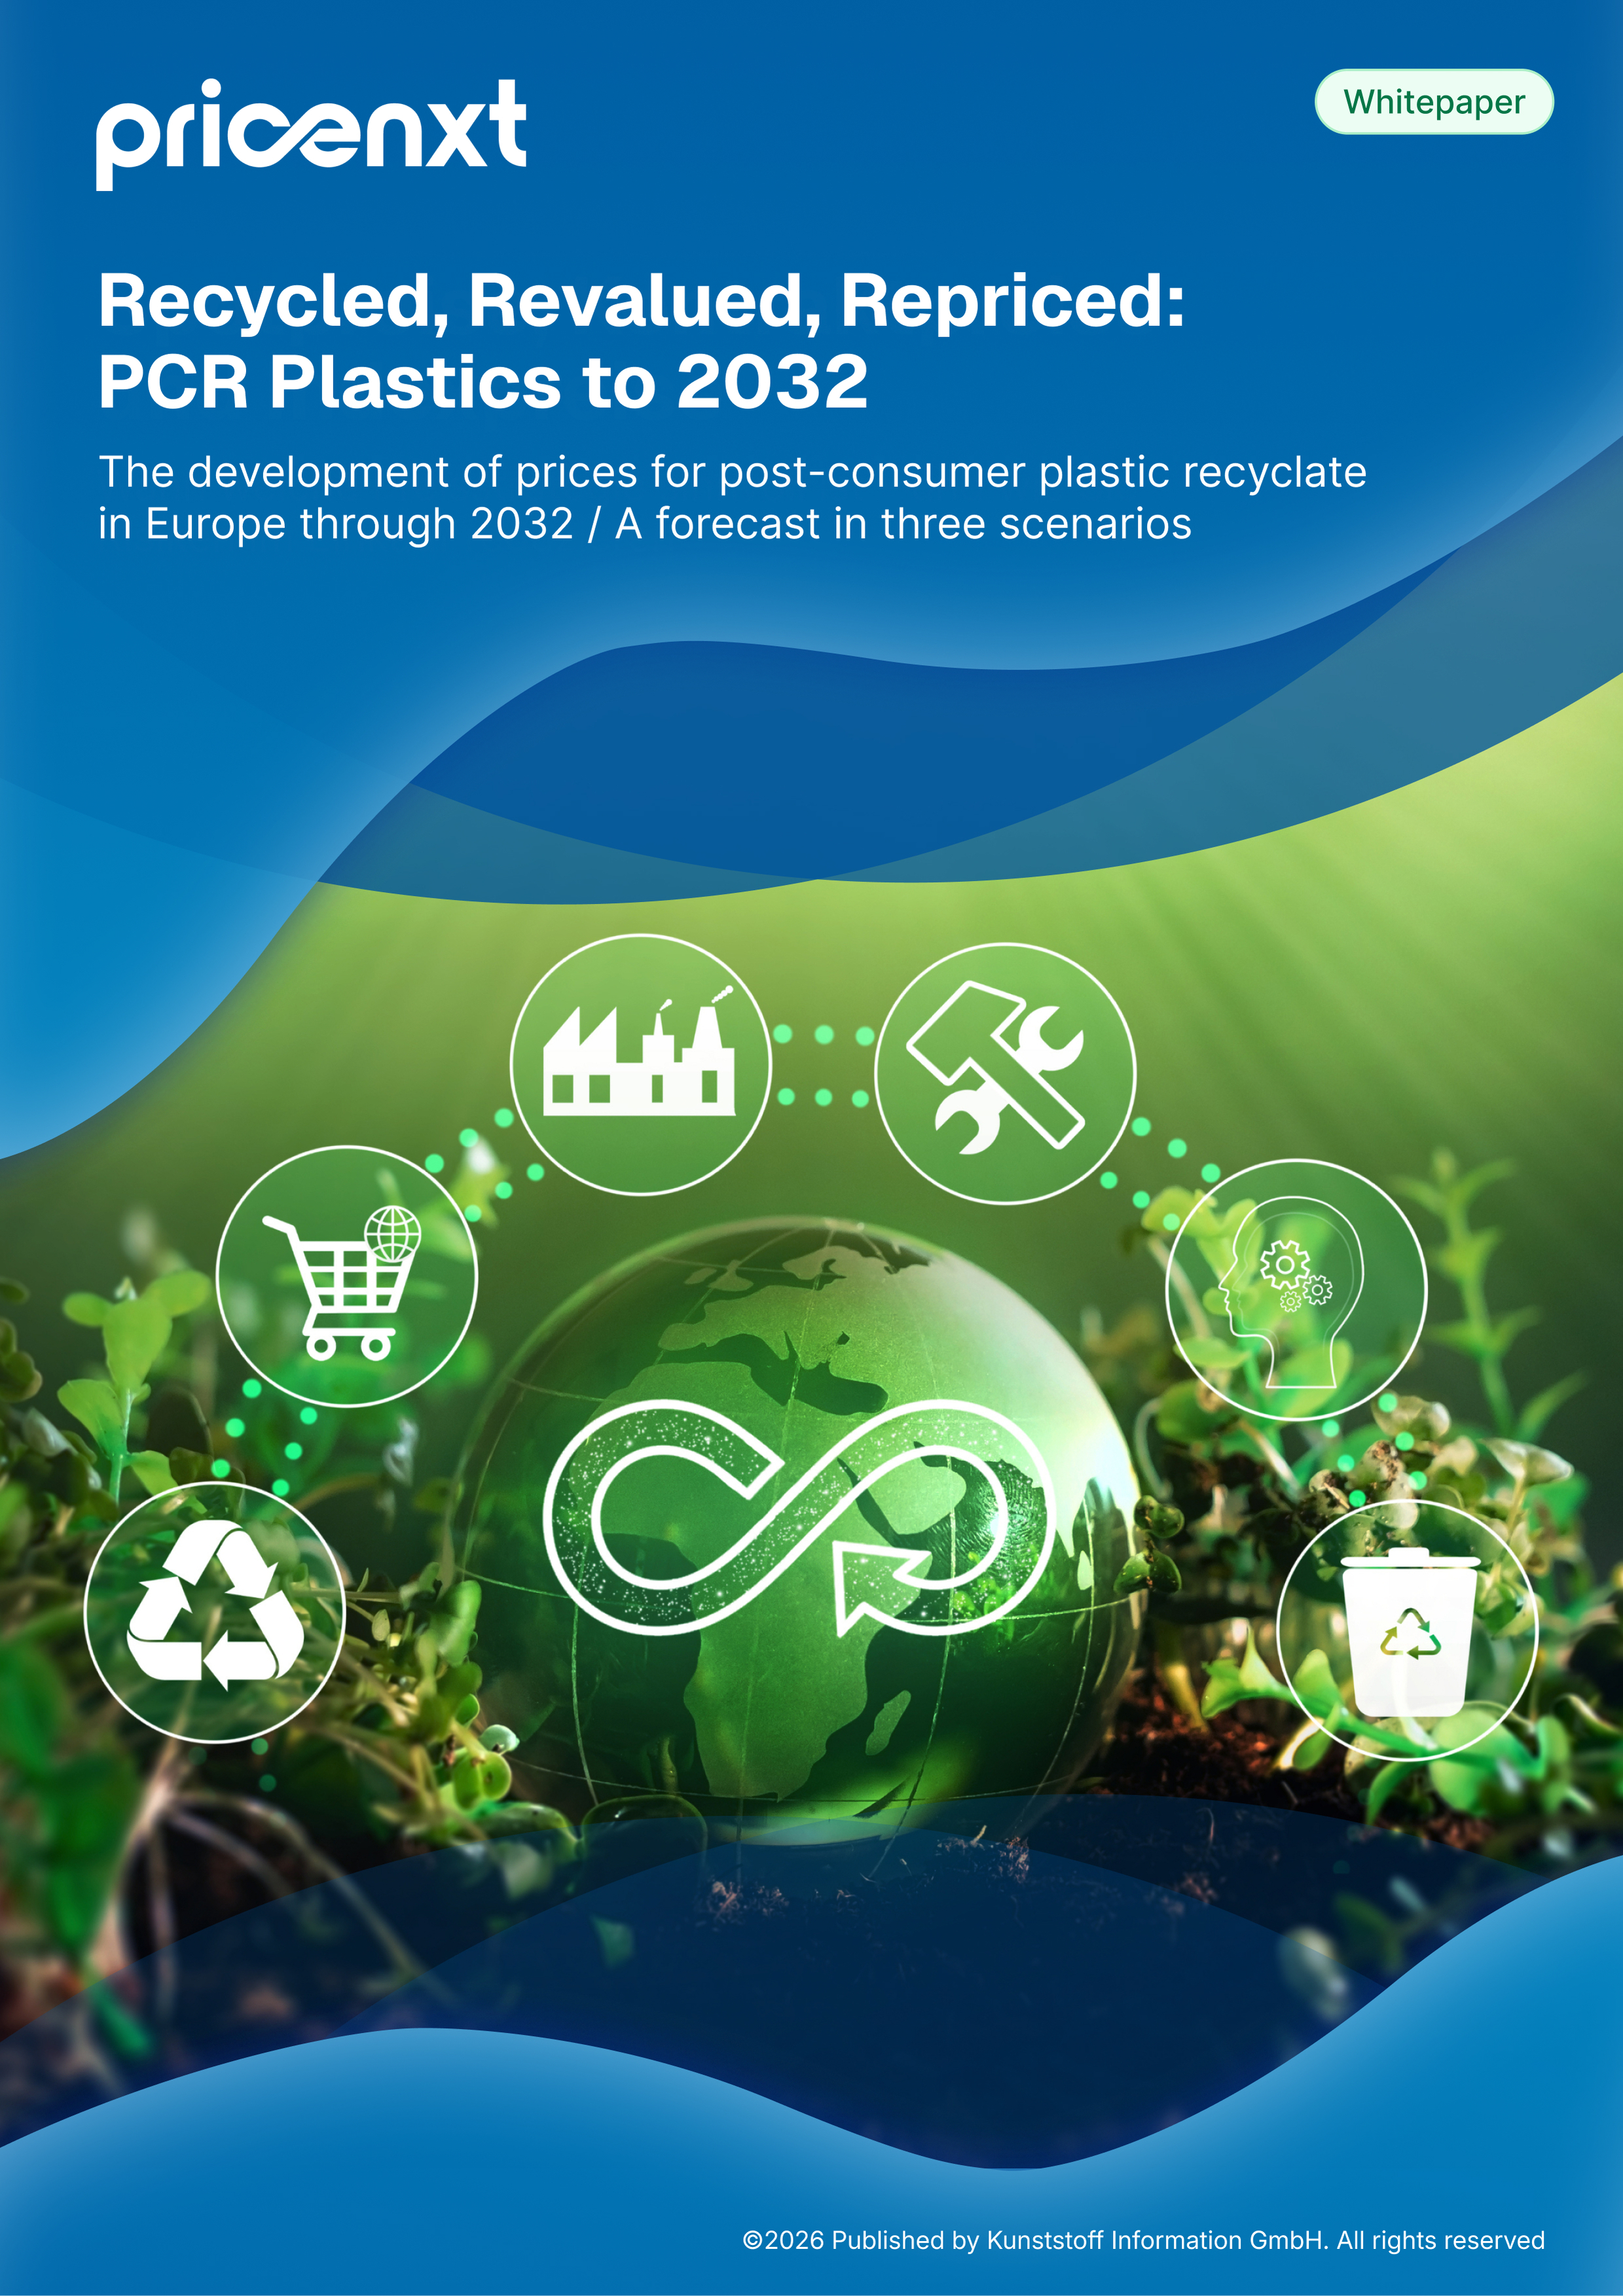
Recycled, revalued, repriced: PCR plastics to 2032
The trend in prices for post-consumer plastic recyclate in Europe up to 2032. A forecast based on three scenarios.
Value for your industry
pricenxt for the chemical industry
The pricenxt Analytics for raw material prices, with which teams in the chemical industry can capture price developments faster, compare price series and build their own market monitoring in a structured way.
Challenges in the chemical industry
Price movements in feedstocks and polymers affect many teams at the same time. What matters is making relevant changes visible and comparable quickly.
- Price relationships are complex
Feedstocks, polymers and price series do not always develop in parallel and must be viewed in a differentiated way. - Commercial teams need fast context
Pricing, sales and product management have to understand market movements before they become relevant in discussions and decisions. - Comparisons across time periods are laborious
Interactive charts help to present trends, deltas, spreads, and index developments cleanly.


Who benefits from reliable material price data?
From analysis to decision: pricenxt supports teams in understanding, contextualising, and communicating price developments in the chemical industry.
- Product management monitors relevant polymers and price series to better underpin portfolio and market decisions.
- Pricing and commercial teams use price developments, spreads and export charts for internal coordination and customer discussions.
- Procurement compares feedstocks and plastics prices to factor market movements into sourcing decisions faster.
How the chemical industry uses pricenxt
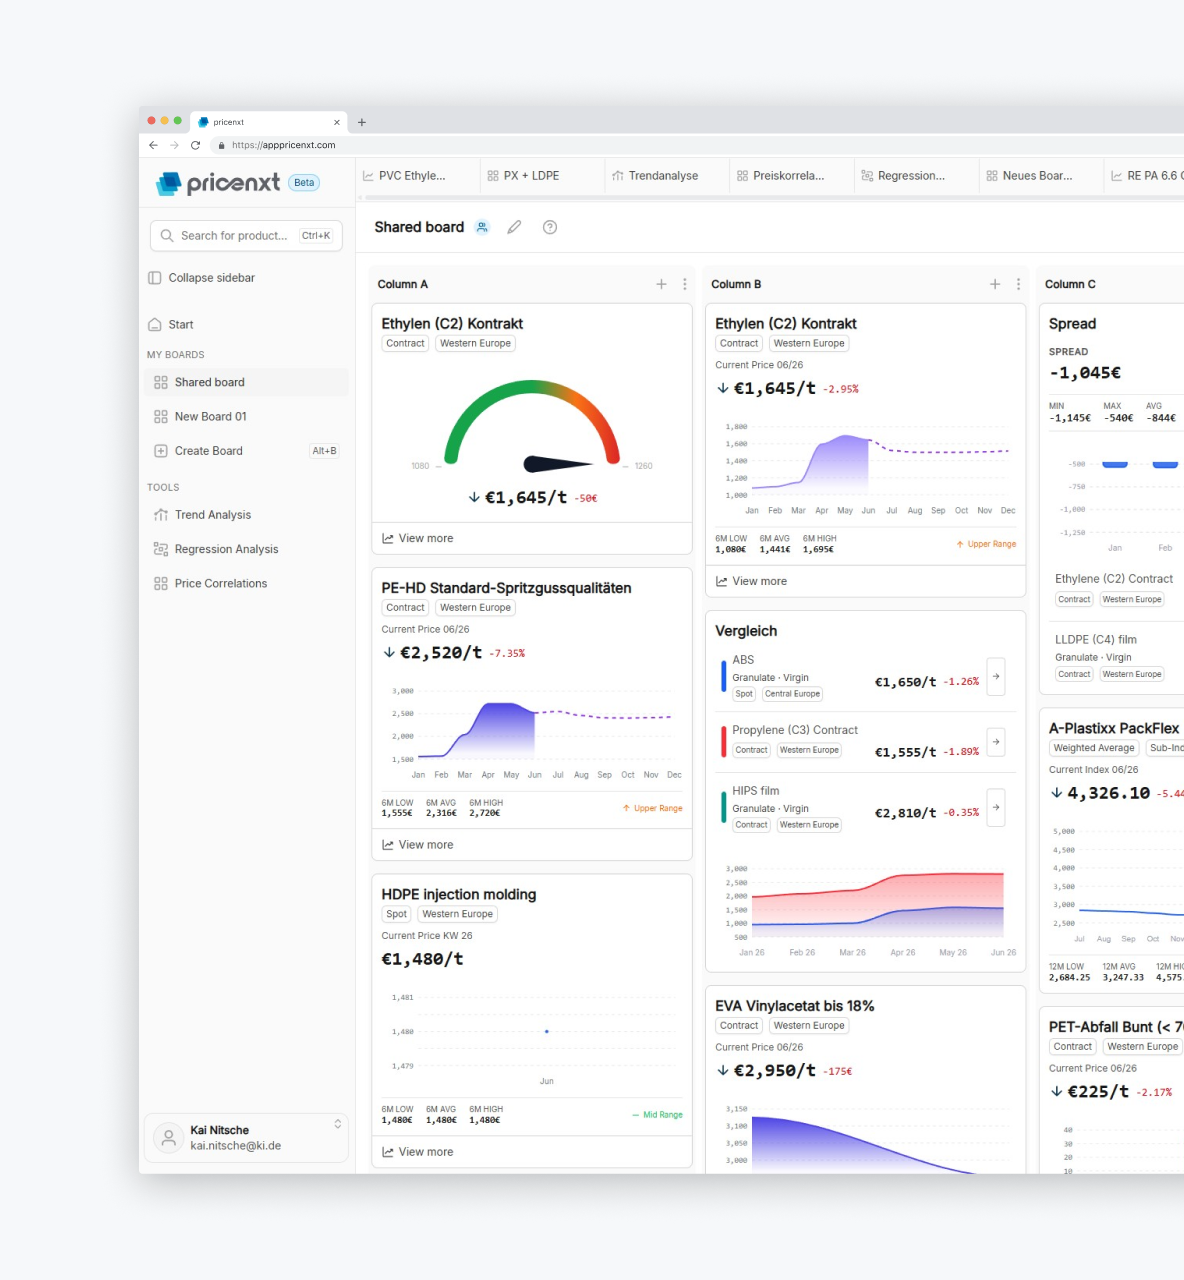
pricenxt combines product search, interactive chart analysis, configurable price cards, and personal boards in a browser-based workspace.
- Compare feedstocks and polymers
Analysts use product pages, price series filters, and shared chart views for structured comparisons. - Build commercial boards
Teams bundle important price cards for products, segments or regions and review changes regularly. - Document market movements
Charts, trend lines, deltas and saved analyses help to communicate developments in a traceable way.
pricenxt. Try it for 30 days.
Use pricenxt free for 30 days. Analyse price movements, forecasts and much more.