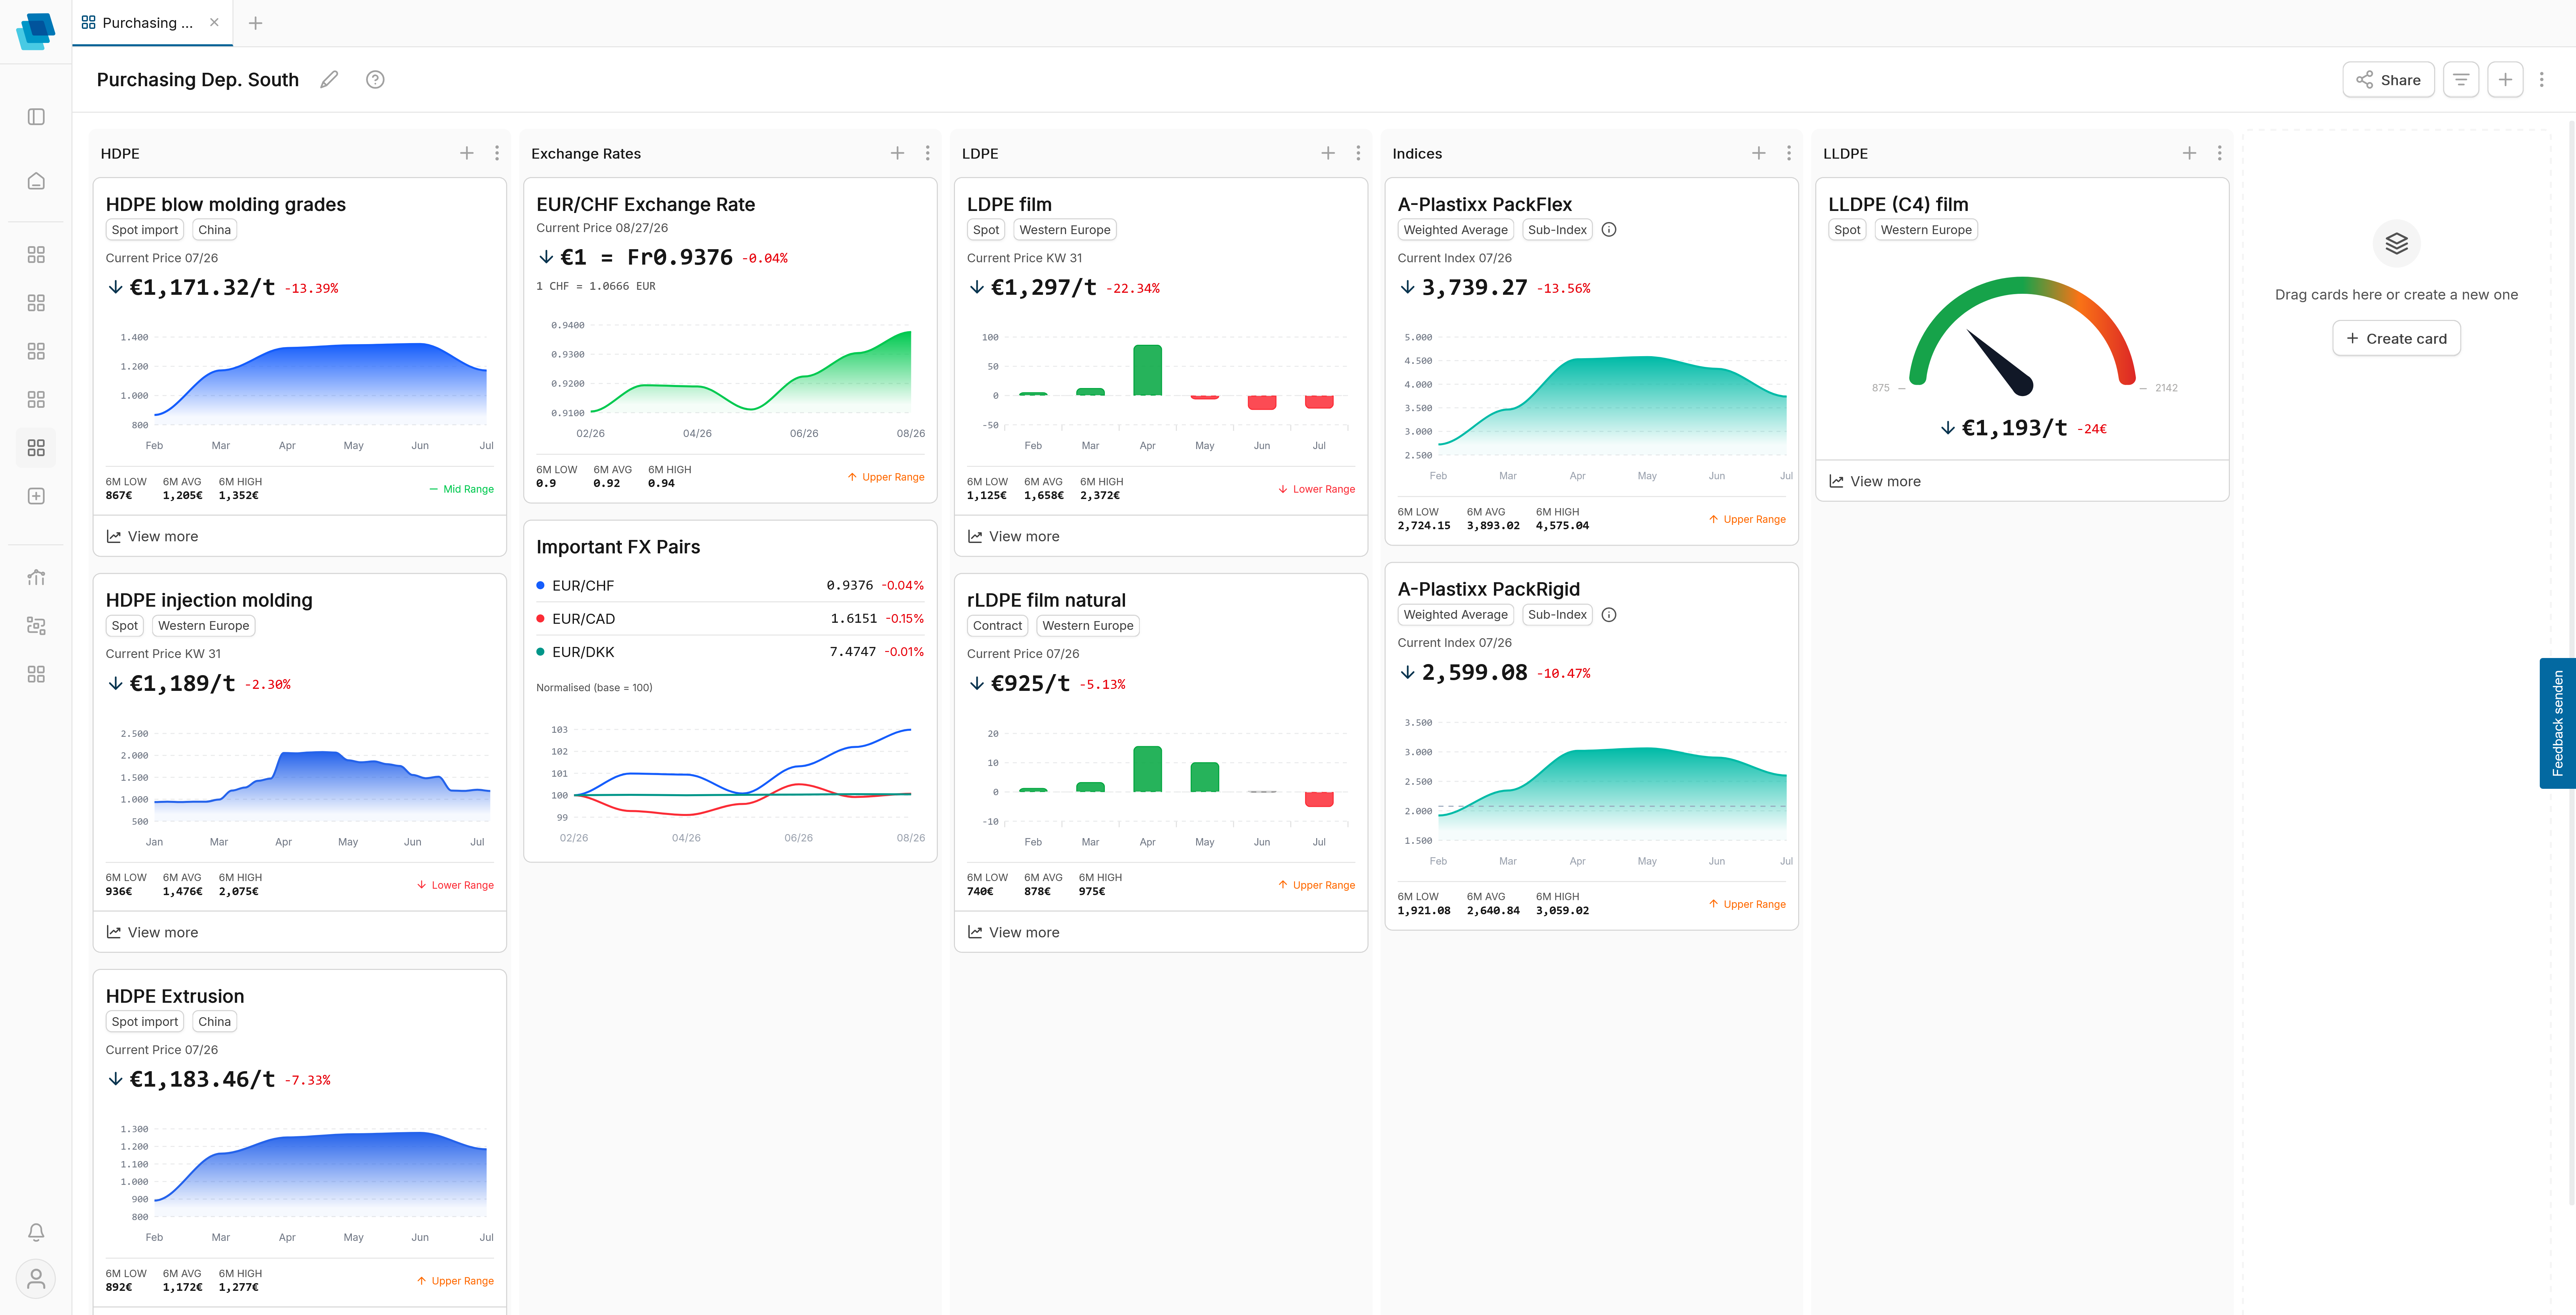


Compare prices. Spot trends first.
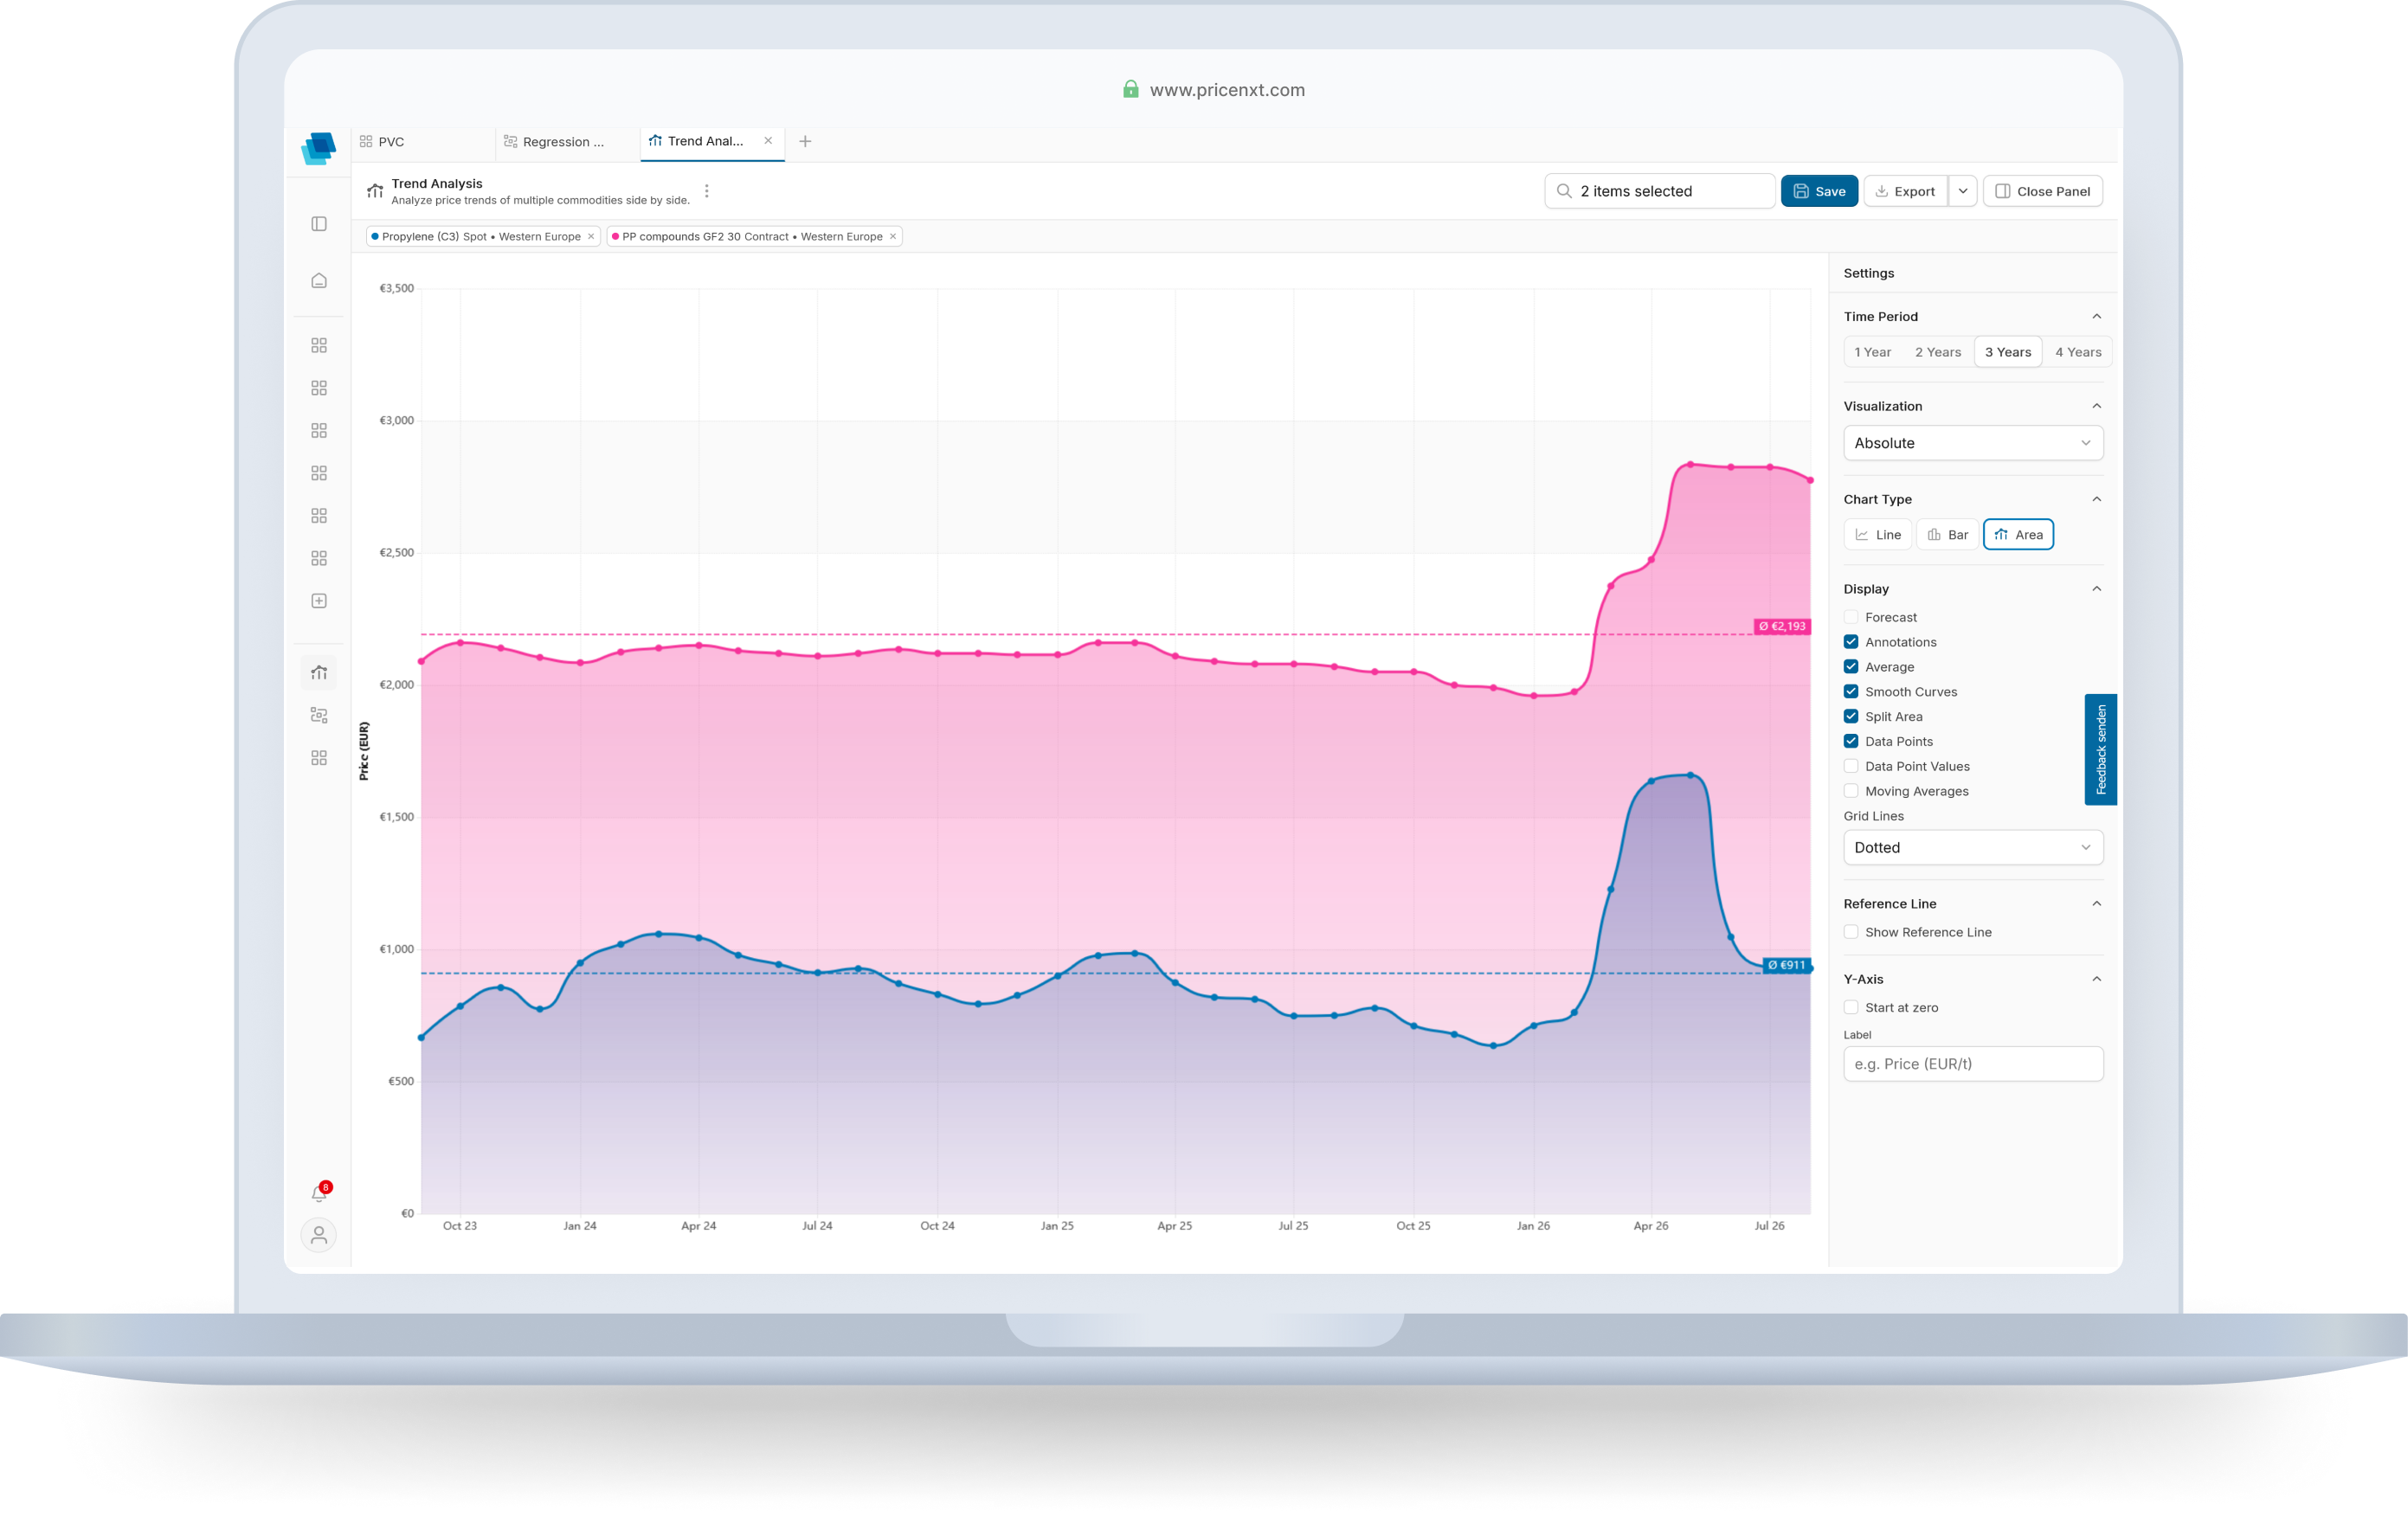
Market data you can trust
pricenxt makes price developments from KI – Kunststoff Information and PIE – Plastics Information Europe available for interactive analysis.
What you analyse:
- Materials and price series
- Historical price series
- Regions and transaction types
- Spot prices, contract prices, and indices
- Plastixx and selected A-Plastixx indices
- Saved analyses and team boards
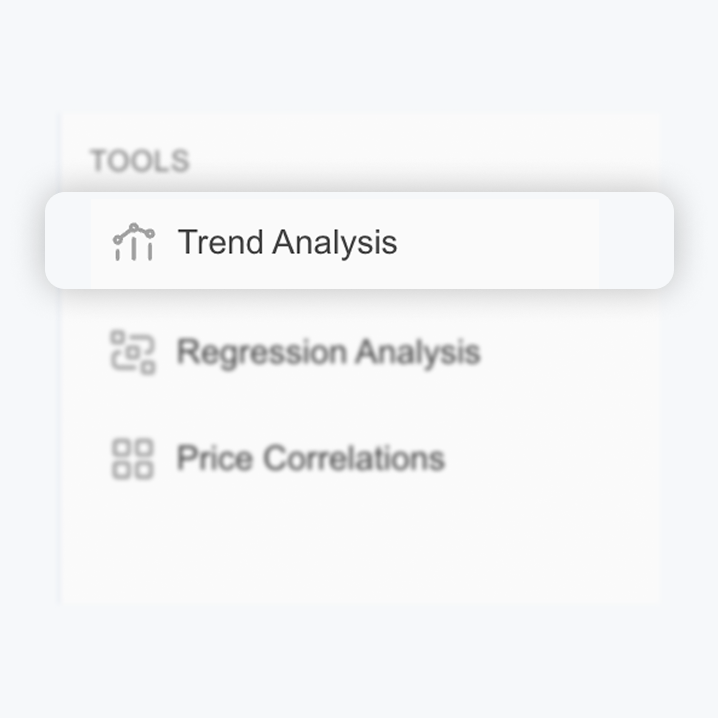
Everything that makes your price analysis more effective
Make price developments visible. Analyse price movements in a more targeted way. All in the trend analysis tool.
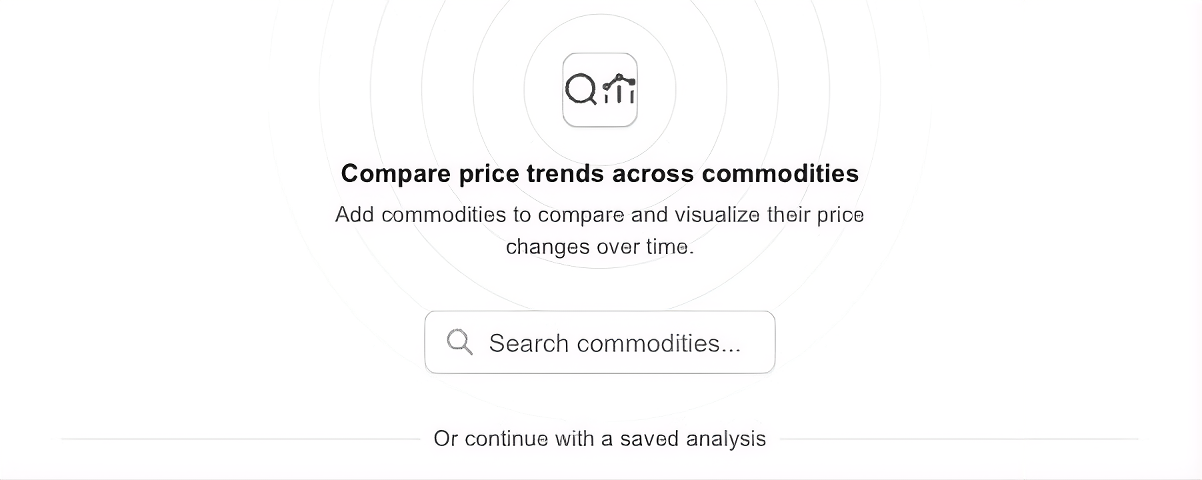
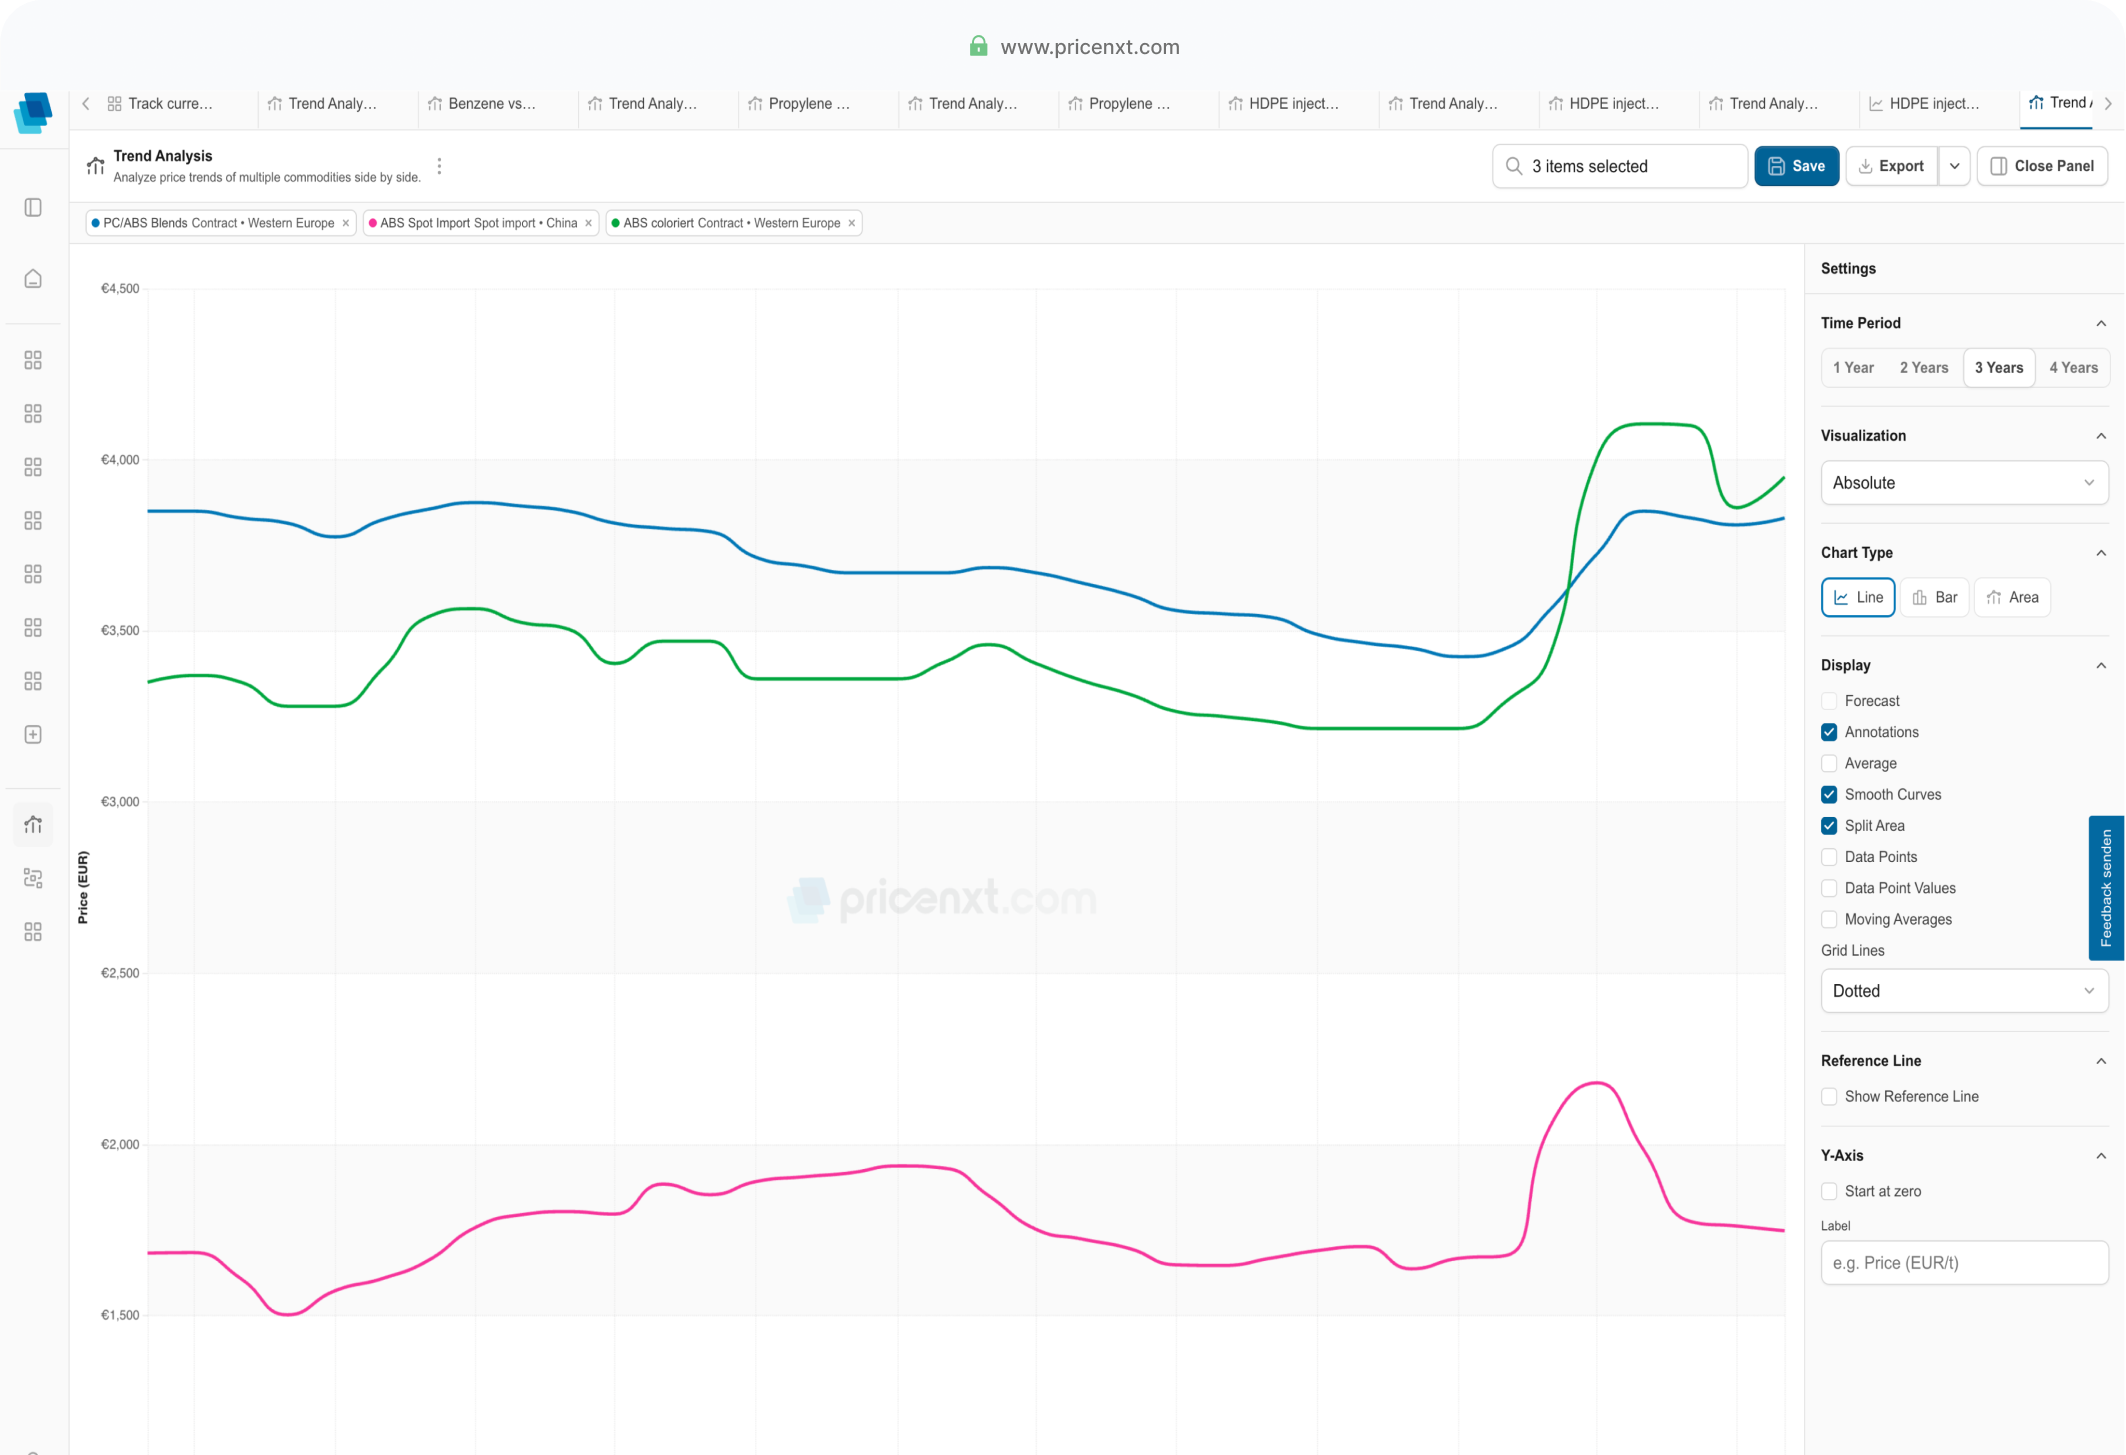
Compare price series freely
Choose materials, transaction types, and regions. Compare developments directly in one shared view.
- Review historical price developments
- See price ranges and deltas instantly
- Use quick filters and advanced filters
Put developments into context instantly
Adapt the view to your analysis – from the time period to the chart type and additional analysis aids.
- Use line, bar, and area charts
- Show averages and reference lines
- Make data points and values visible
Give every price movement the right context
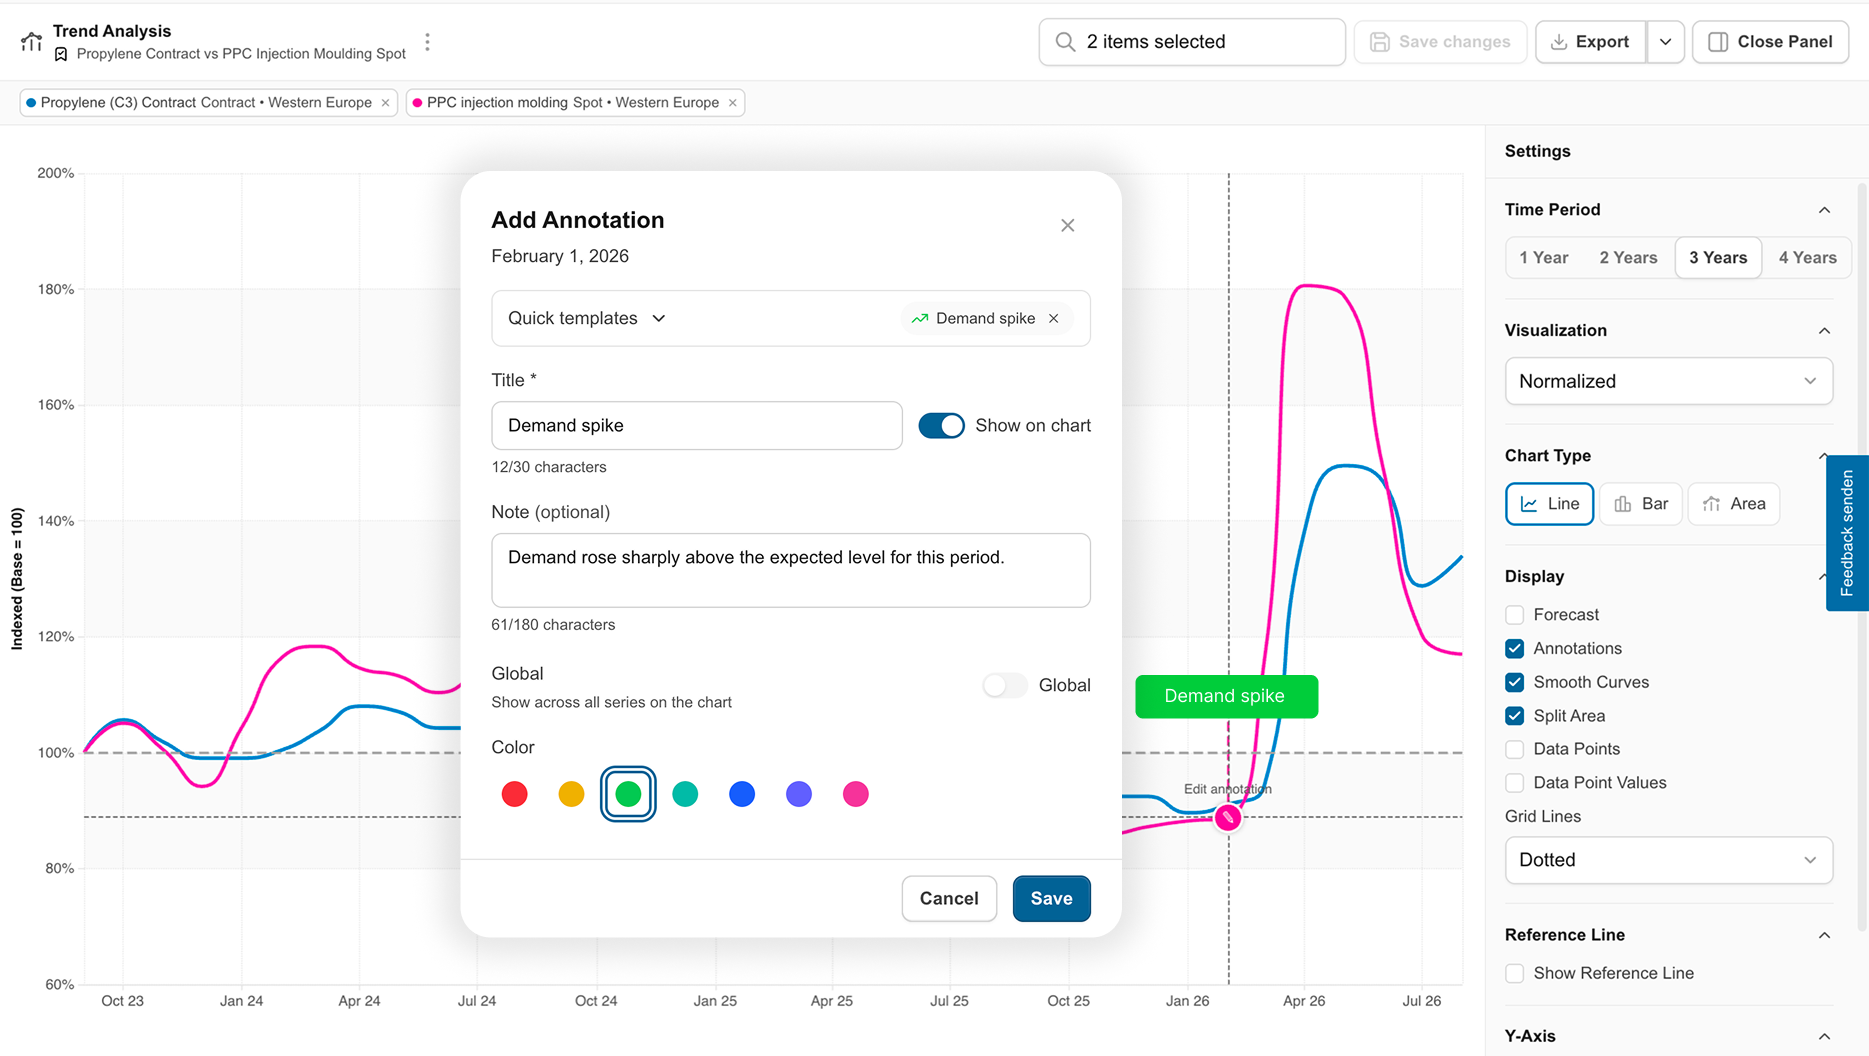
Market events, supplier changes, project milestones or internal decisions shape your assessment. Add annotations directly to the chart.
- Add a date and a note
- Explain market movements clearly
- Make project phases visible
- Record the price level at the point of decision
- Find analyses again easily later
Your analysis stays usable. Not just visible.
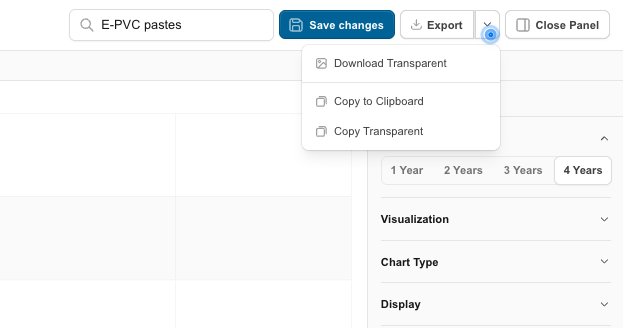
Save important analyses. Share results with your team. Export charts for meetings, quotations, change orders or internal assessments.
- Save analyses
- Export charts
- Share results via share link
- Use analyses as cards on boards
- Open recurring analyses faster
For everyone who needs to assess price movements faster
Materials procurement
Compare materials, transaction types, and regions directly side by side. Prepare price negotiations, purchasing windows, and framework agreements with reliable market data.
Price analysis
Combine several price series in one view. Spot trends, deviations, spreads, and historical movements faster.
Controlling and planning
Document price drift between quotation, budget, and execution. Use charts, reference lines, annotations, and exports for internal assessments.

pricenxt. Try it for 30 days.
Use pricenxt free for 30 days. Analyse price movements, forecasts and much more.