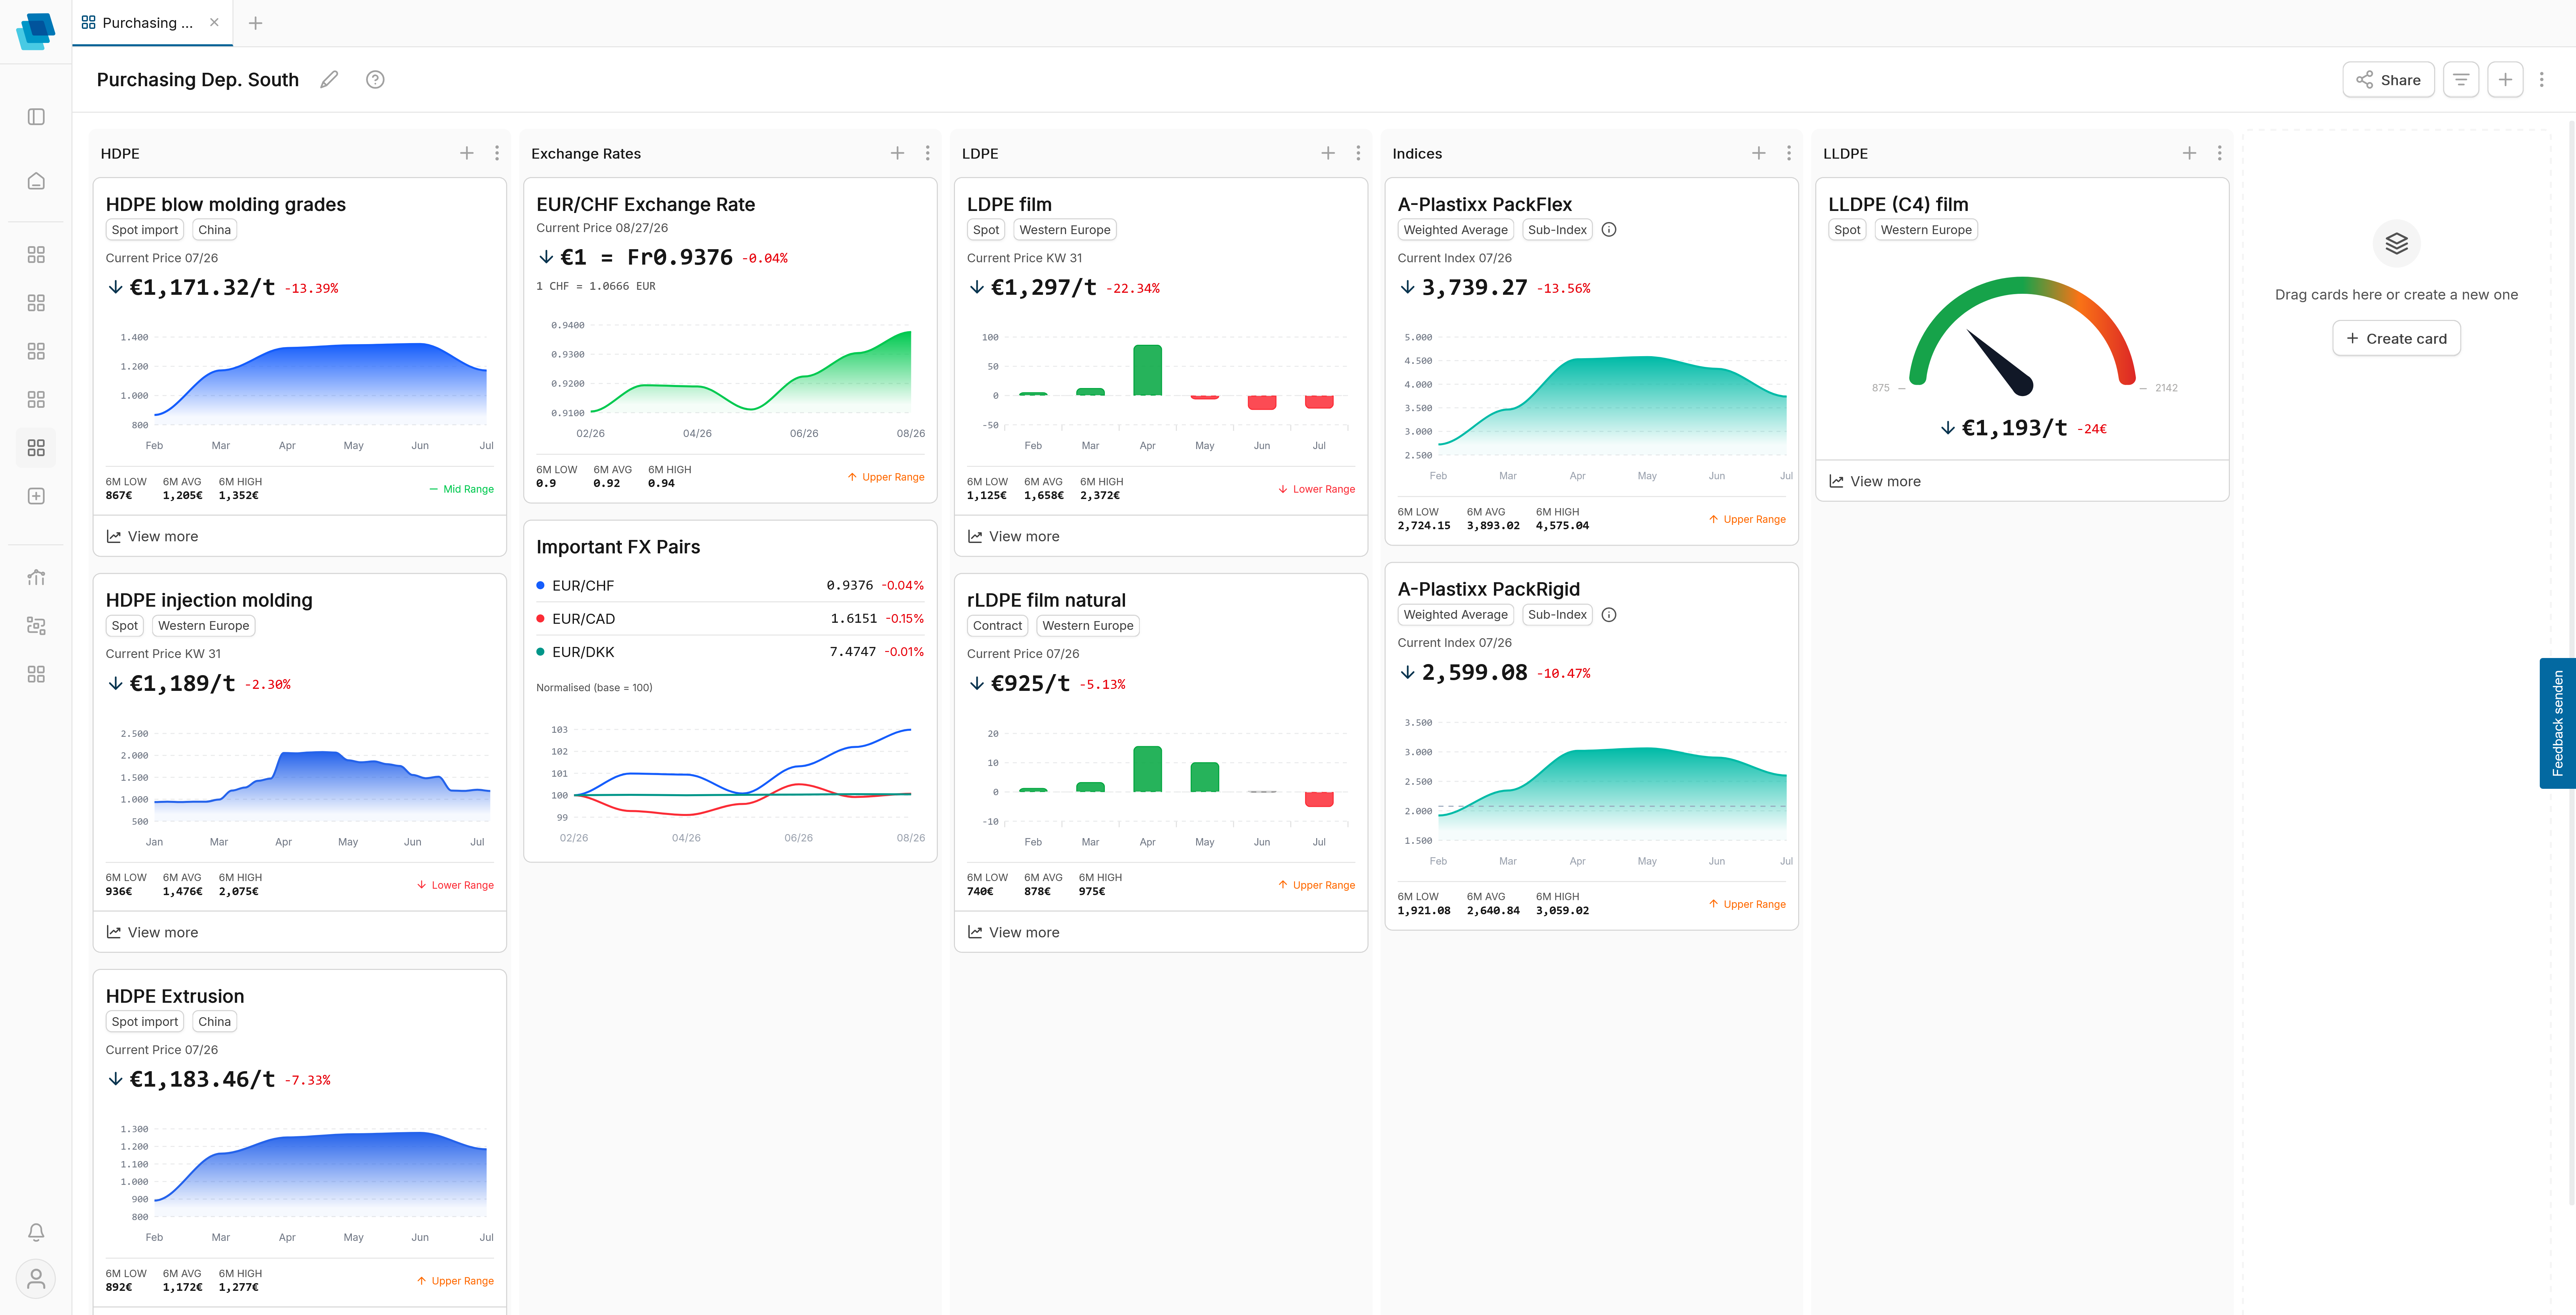


See when prices break from the pattern
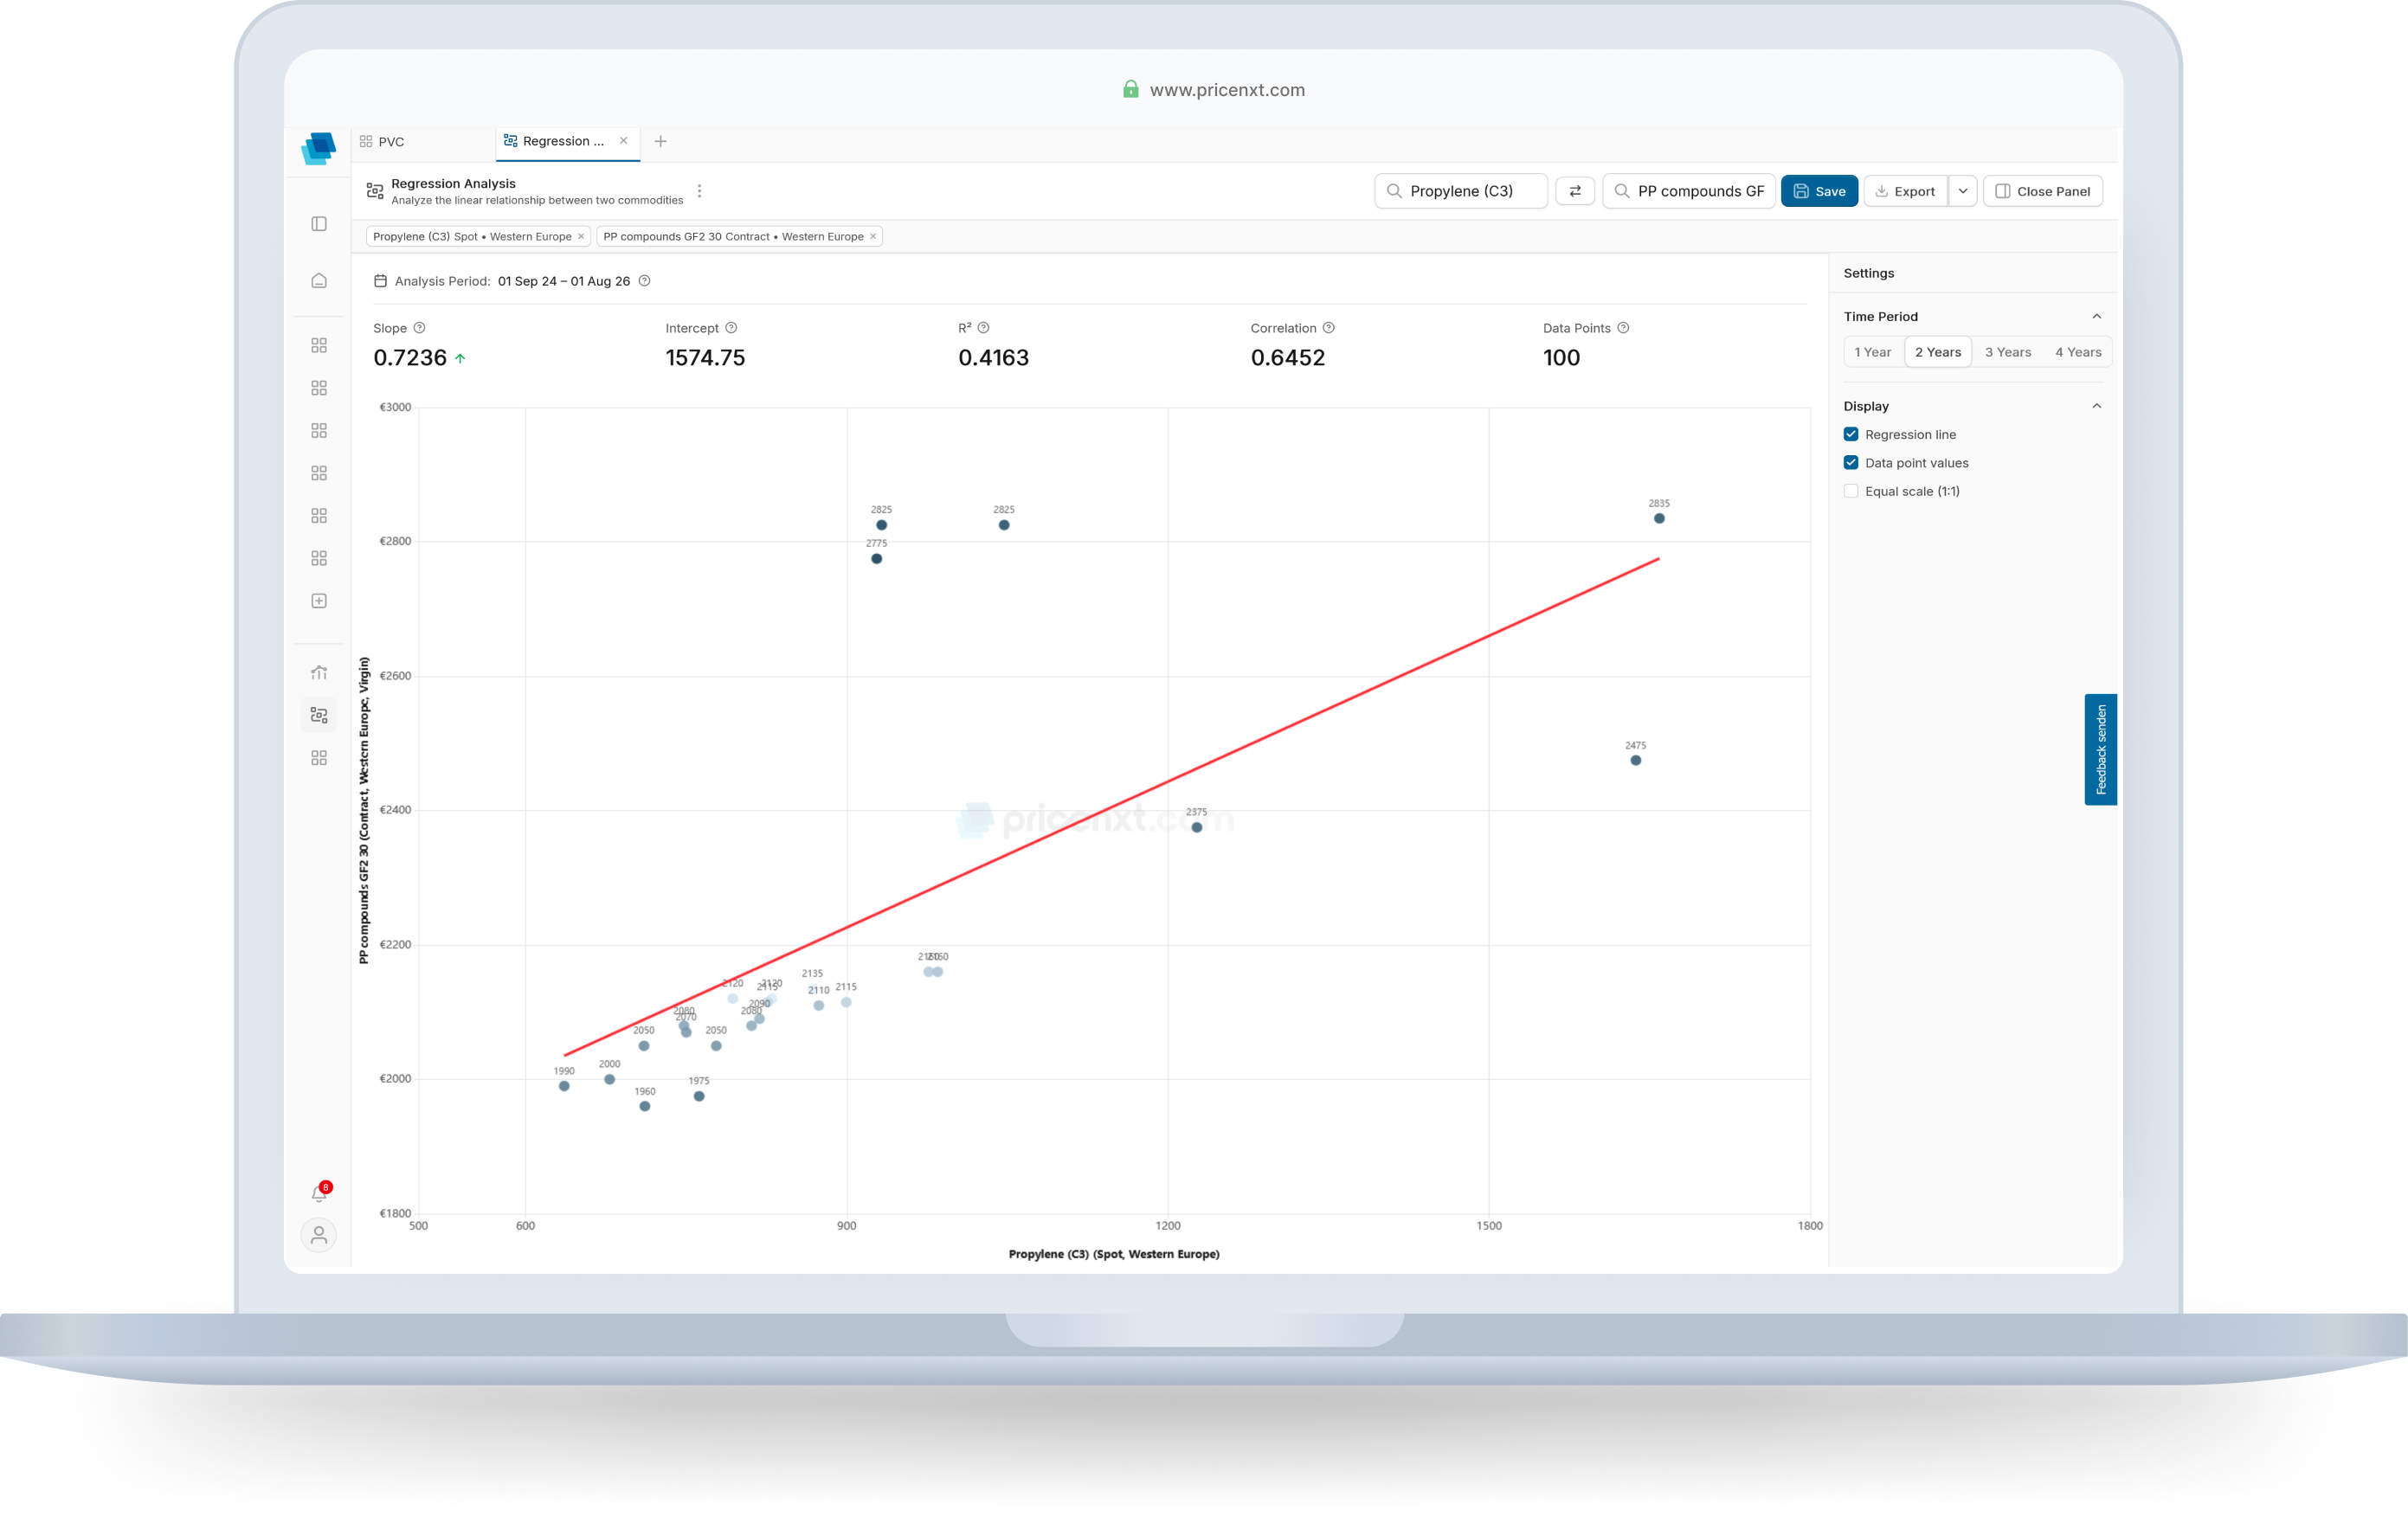
Negotiate with the better number
Regression analysis shows whether a price demand fits the historical relationship. This helps you conduct supplier negotiations more clearly, check alternatives faster and justify decisions soundly.
What you analyse:
- Price relationships between two series
- Historical coupling of materials
- R², correlation and outliers
- Deviations from the normal range
- Price gaps for alternatives
- Evidence for procurement, controlling, and management
Understand price relationships. Spot deviations.
Compare two price series. See how closely they move together. Recognise instantly when a price looks unusually high or low.
Make price relationships visible
Compare two price series directly. See whether materials have moved similarly in the past, how strongly they are coupled and how stable the relationship is.
- Analyse relationships between materials
- Interpret correlation and R² clearly
- Make historical price relationships visible
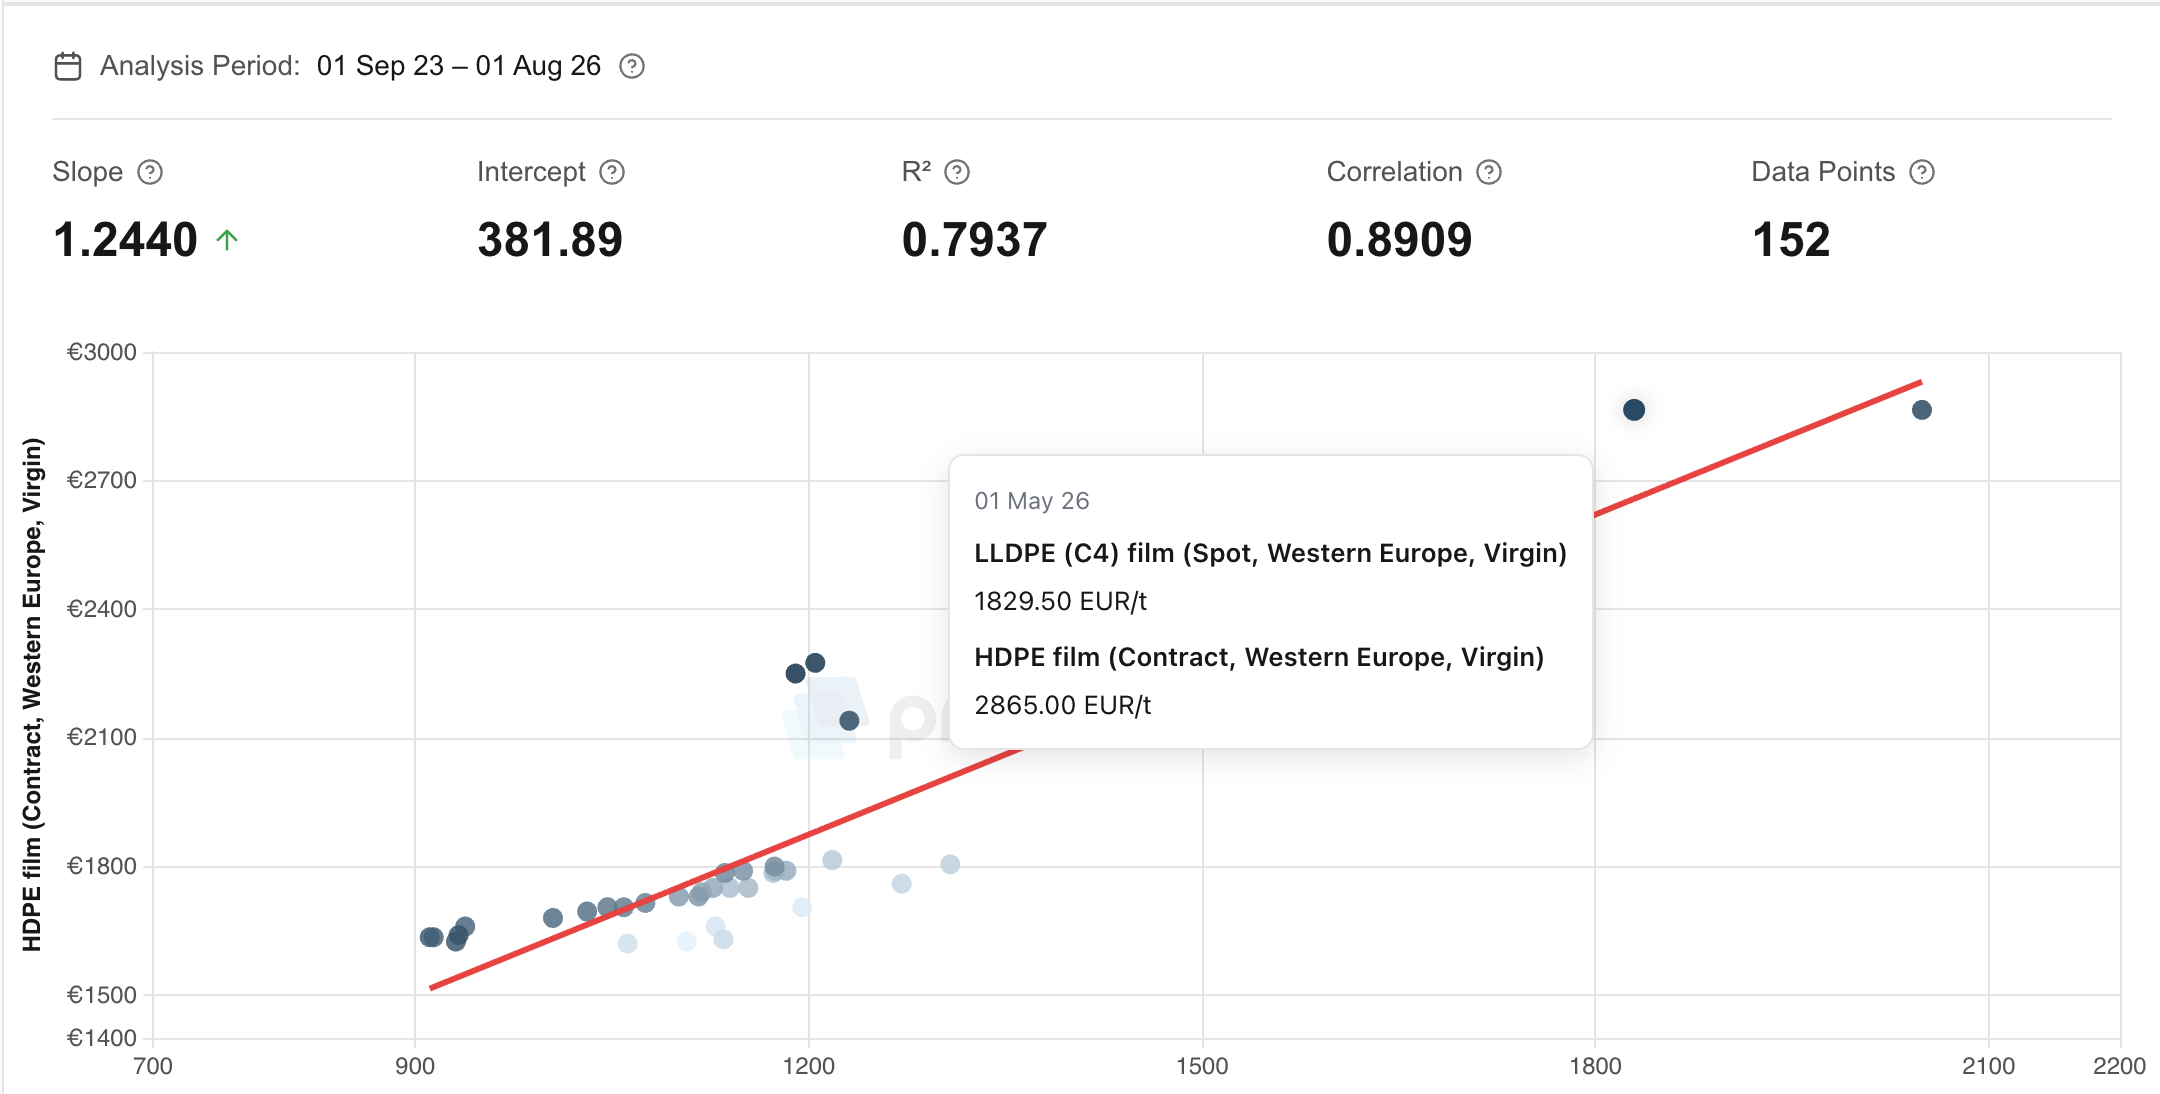
Spot deviations faster
The regression line shows which price level would be expected historically. If a current value lies well above or below it, you see the outlier immediately.
- Check excessive price demands
- Spot favourable purchasing windows
- Document deviations from the normal range
Negotiate with numbers
Turn market movements into a clear basis for discussion. Regression shows whether a price demand fits the historical relationship or needs to be explained.
- Conduct supplier negotiations on a sounder basis
- Justify price movements transparently
- Check demands against market data
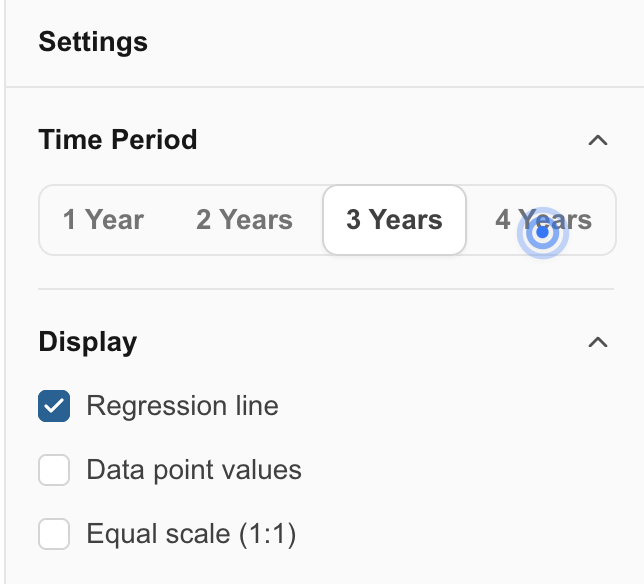
For everyone who needs to keep material costs under control
Prices rarely move on their own. They depend on other materials, raw materials or market indicators. Regression analysis makes these relationships visible and helps you understand deviations from the historical pattern.
Materials procurement
See whether a material looks unusually expensive compared with an alternative. Use price relationships for framework agreements, supplier negotiations, and procurement decisions.
Sales and calculation
Check whether a price gap is large enough to start a technical material assessment. See the cost impact of an alternative earlier in the process.
Controlling and planning
Explain price developments with historical relationships. Make internal assessments, budgets, and change orders more robust.

pricenxt. Try it for 30 days.
Use pricenxt free for 30 days. Analyse price movements, forecasts and much more.