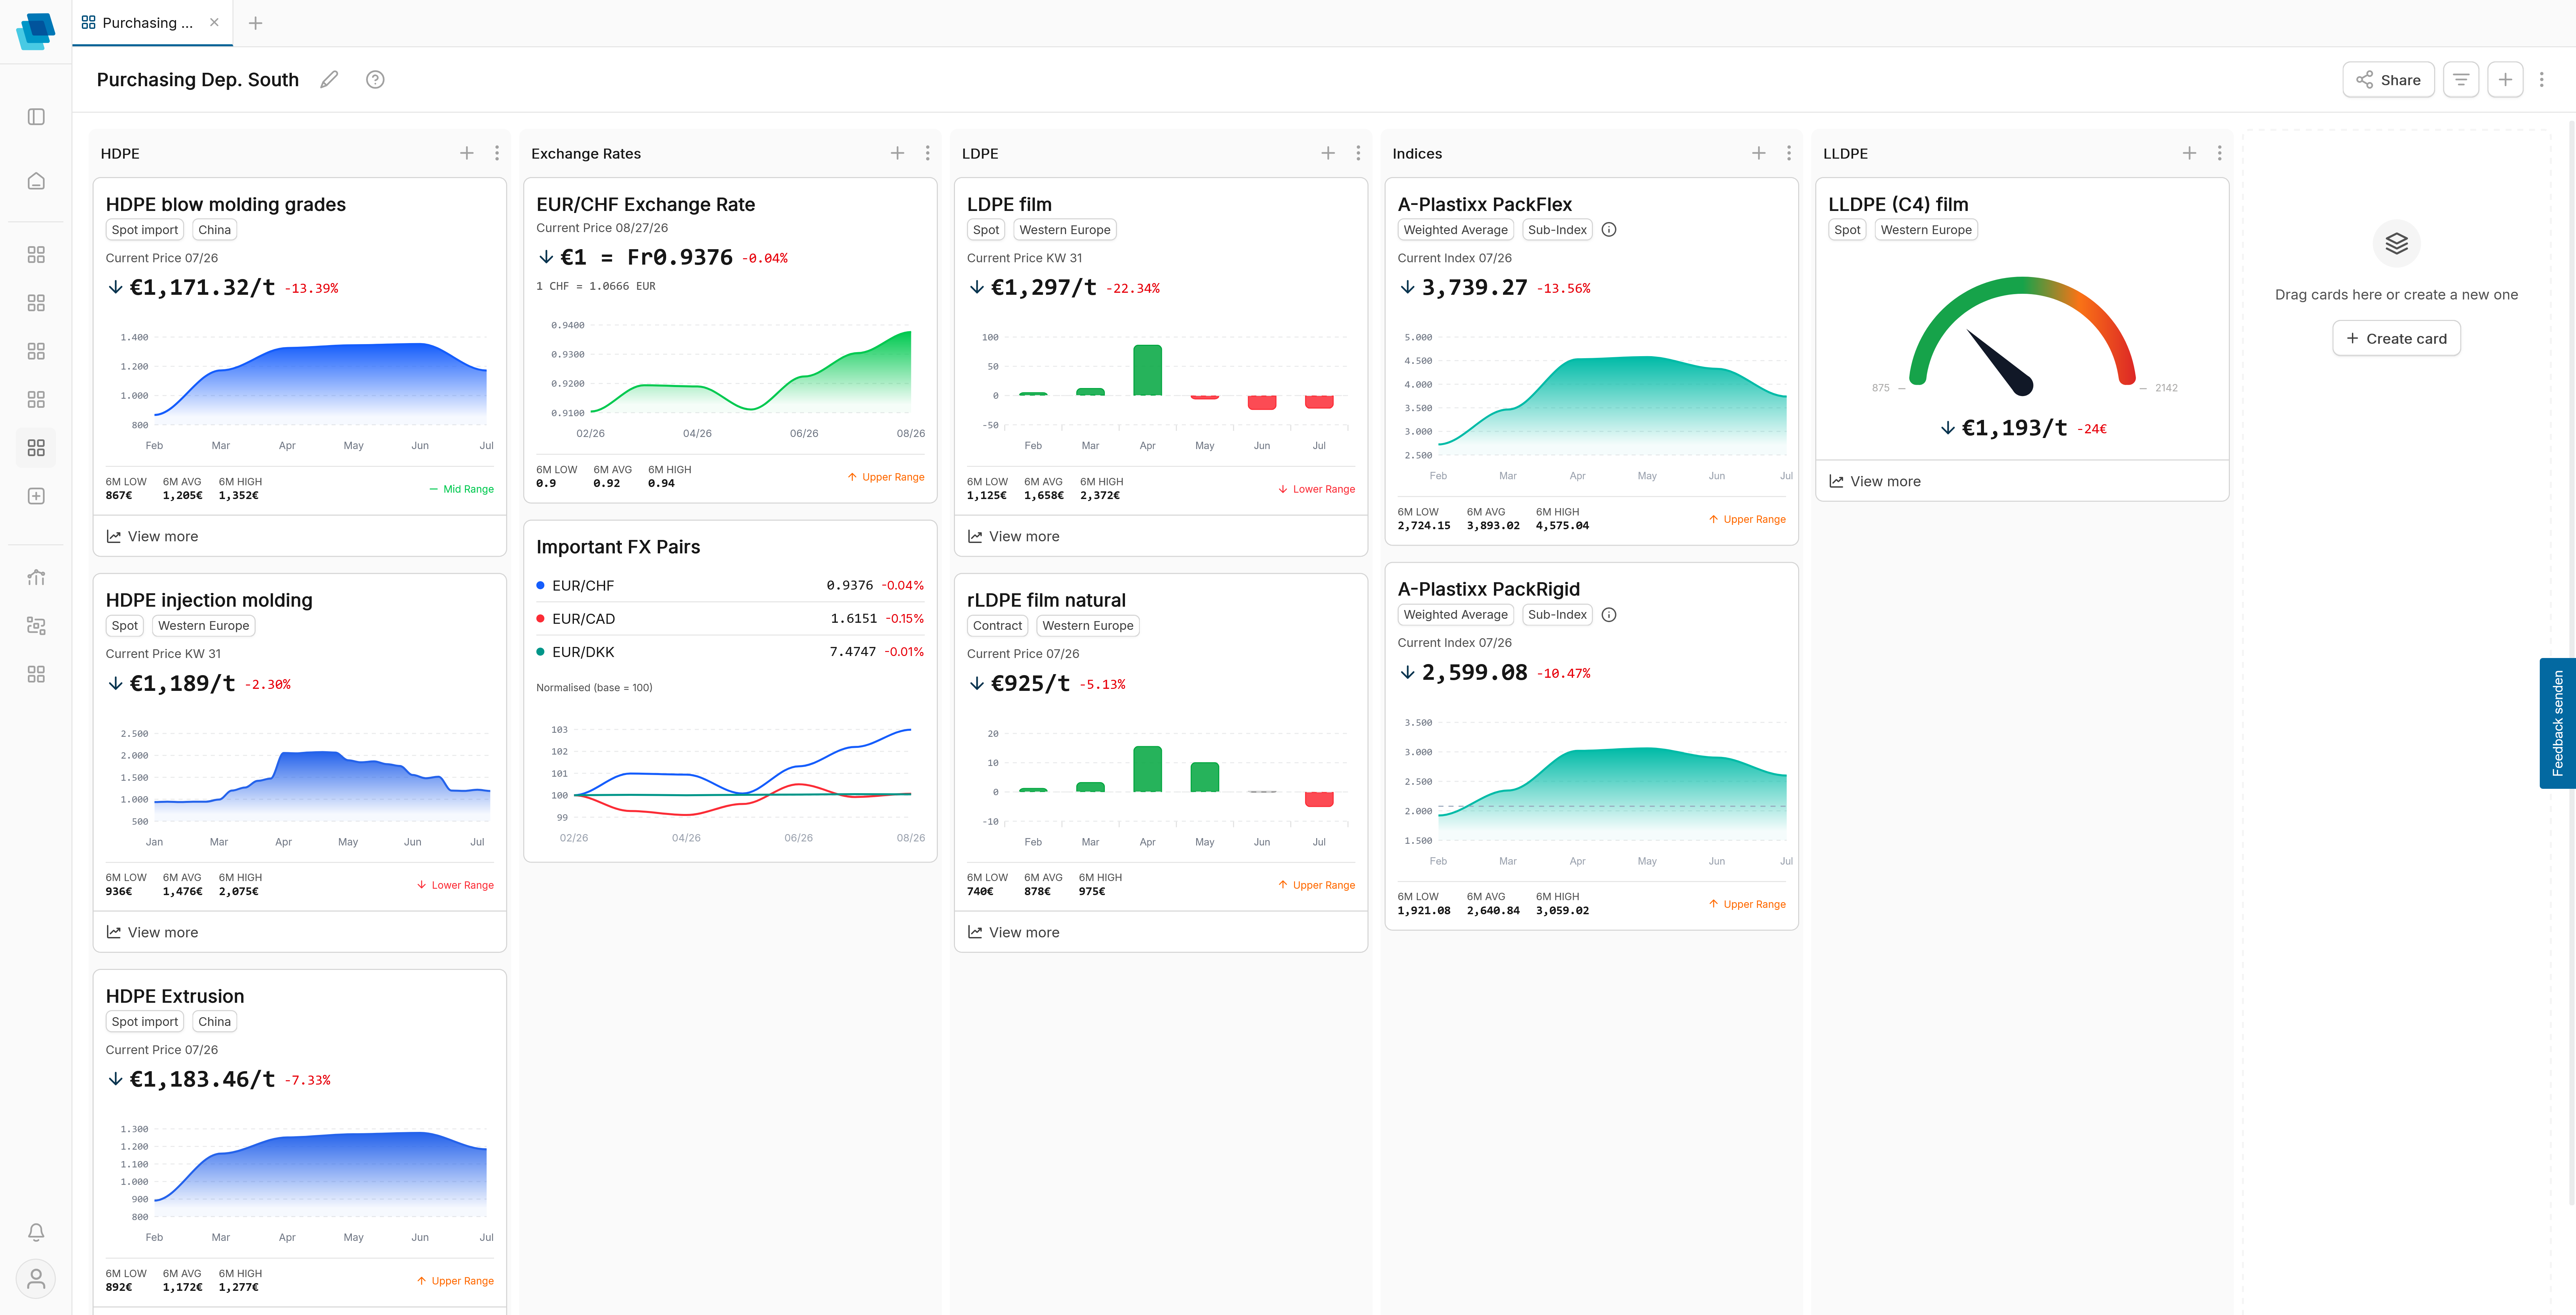


See which prices move together
Correlation analysis reveal which materials, feedstocks, and price series move in step. Recognise relationships. Understand patterns. Decide better.
Market logic at a glance
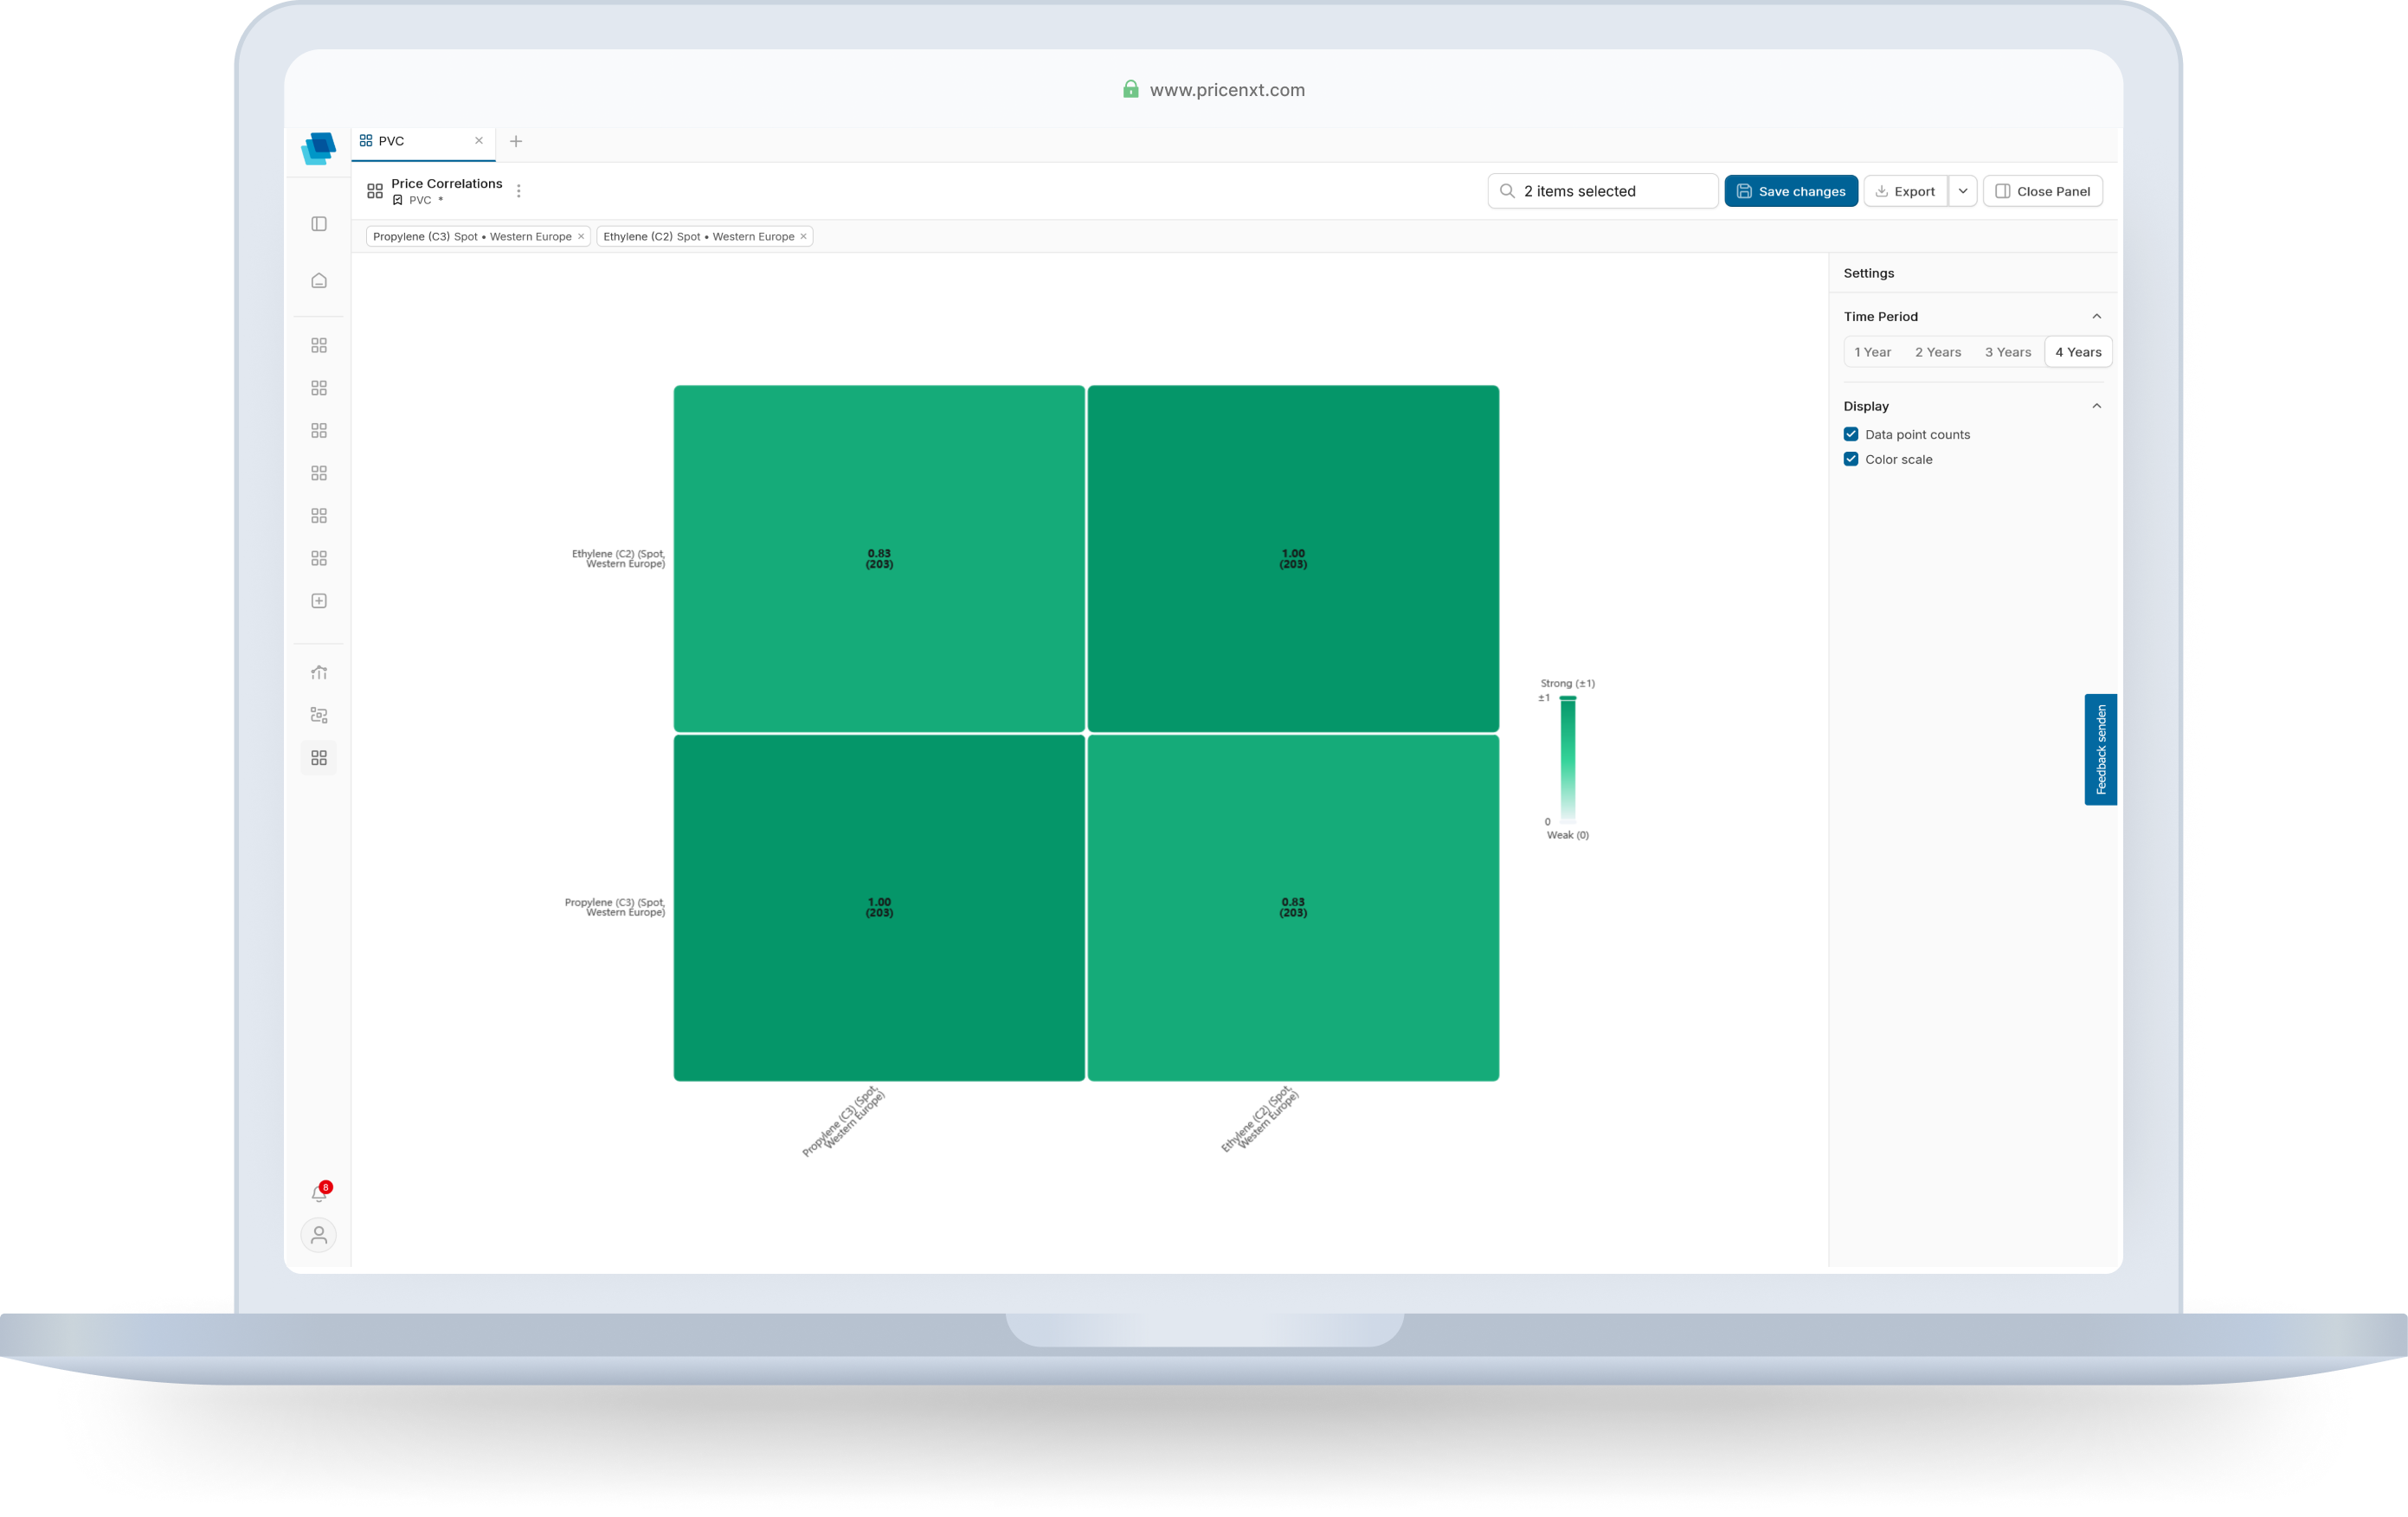
Prices often move together. pricenxt shows these connections clearly in a correlation matrix, so you find patterns, outliers, and possible drivers faster.
What you analyse:
- Price series with similar developments
- Strong, weak, and loose relationships
- Correlation matrix for each selection
- Freely selectable analysis periods
- Colour scale for quick interpretation
- Exportable analyses for your team
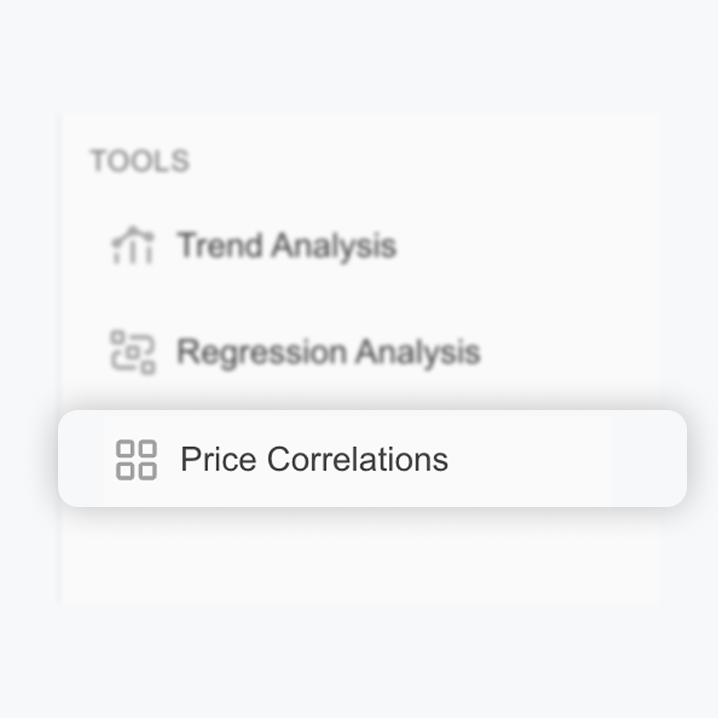
Make price relationships visible
Everything you need to put price movements into context. Directly in the pricenxt pricenxt Analytics.
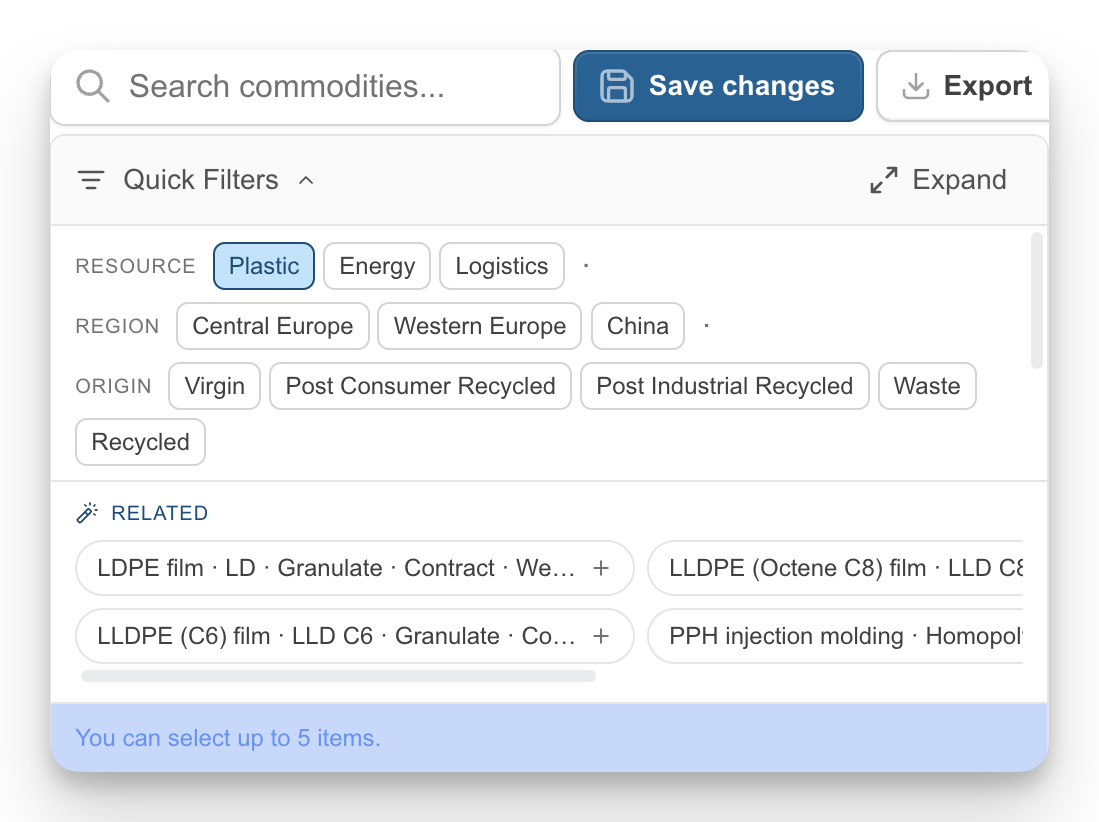
Compare up to five price series
Select several materials, feedstocks or price series. Compare their developments directly. See which prices move alike and where patterns break down.
- Select up to five price series
- Find materials via search and filters
- Narrow down price series, regions, and transaction types
Recognise relationships in seconds
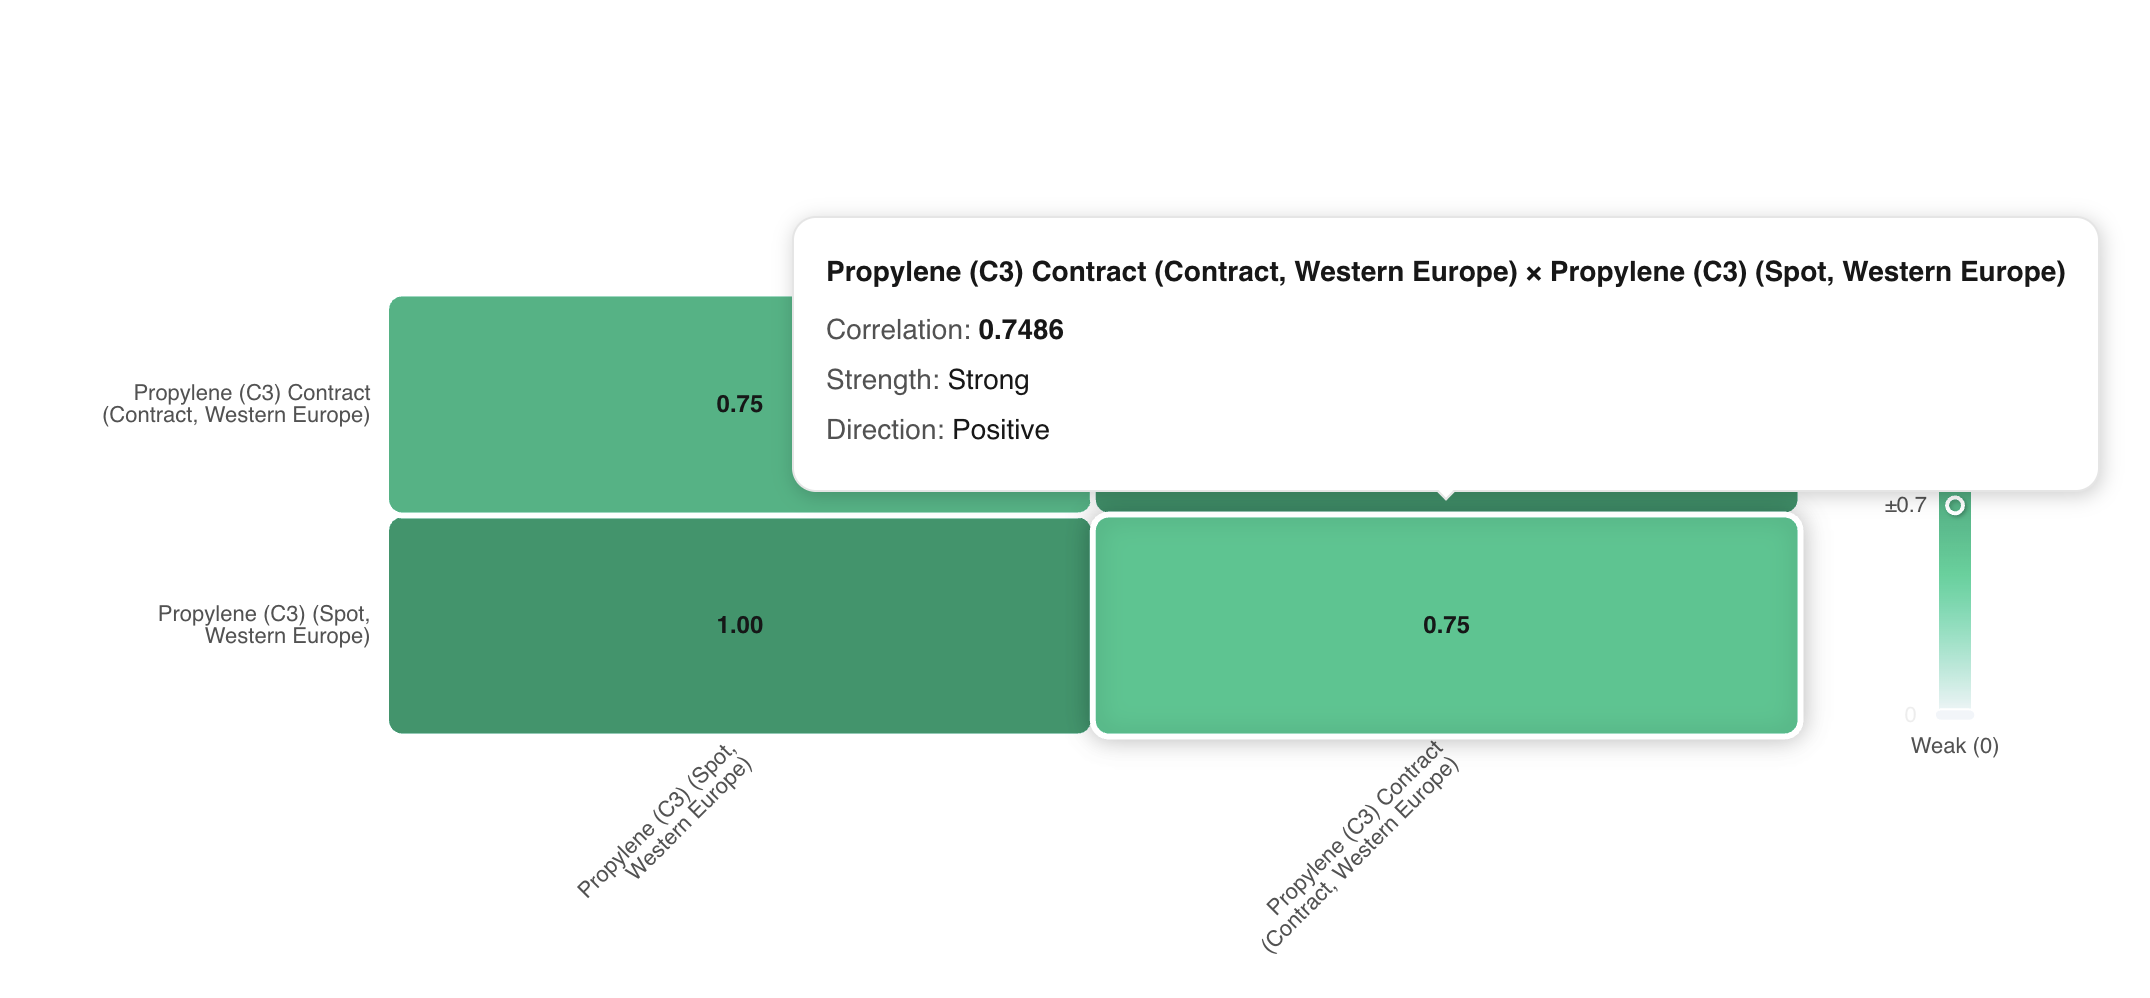
The correlation matrix shows you instantly which price series are strongly, weakly or only partly related. No spreadsheet chaos. No lengthy searching.
- See correlation values directly in the matrix
- Assess the strength and direction of the relationship
- Show the number of data points
Customise your analysis
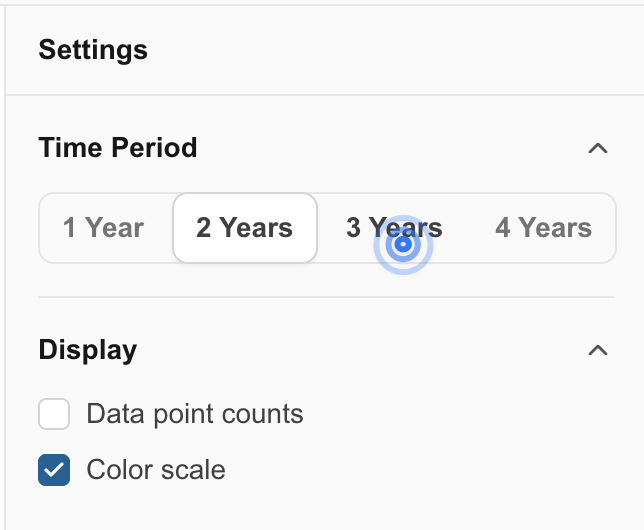
Examine short and long periods. Show or hide the colour scale. Save and export your analysis for your team, procurement, controlling or management.
- Choose a period from 1 to 4 years
- Show or hide the colour scale
- Save and export the analysis
Make market logic visible
See which materials and raw materials have developed similarly over time. Recognise market relationships. Pinpoint deviations.
Materials procurement
Find materials with similar price movements. Use this view for procurement strategies, alternatives and negotiations built on a real market basis.
Sales and calculation
Compare several price series at once. Recognise relationships, outliers, and possible drivers in the market.
Controlling and planning
Explain price developments transparently. Prepare assessments, budgets, and scenarios properly.

pricenxt. Try it for 30 days.
Use pricenxt free for 30 days. Analyse price movements, forecasts and much more.